

How to Backtest a Trading Strategy (Build Real Proof)
Learn how to backtest your trading strategy step by step using TradingView bar replay. Build real conviction in your plan before risking live capital.

Backtesting a trading strategy means replaying historical price data as if it were live, making trade decisions with no view of what comes next, and recording every result. You do this to answer one question: does your plan actually produce an edge?
Not "does it look good on a few cherry-picked charts." Does it hold up across 50, 80, 100 trades where you had zero hindsight advantage?
Think of it like test-driving a car before you buy it. You would not hand over the money based on photos alone. You want to feel how it handles on actual roads, in traffic, in rain. Backtesting is the test drive for your trading plan. Skip it, and you are funding your education with live capital. That is an expensive classroom.
TL;DR
Backtesting = testing your plan on historical data with no hindsight. Use TradingView's bar replay to flatten the chart and step forward bar by bar.
You need 50-100 fully annotated trades before your win rate means anything. Below 30, it is noise.
Record everything: pair, entry model, R multiple, market phase, confluences, annotated screenshot, and one lesson per trade.
Do not cherry-pick dates or rush through setups. Both habits produce data that falls apart the moment you go live.
Backtesting builds conviction from evidence, so when you take a loss on a live trade, you know it is a normal part of a system that works over time.
Why Most Traders Skip This
You have probably told yourself one of these. Maybe all three. And every one of them felt completely reasonable at the time.
"The market is moving right now and I am missing it." This one gets everyone. Setups are forming, price is running, and you are sitting there watching historical candles like some kind of trading archaeologist. It feels wrong. But here is the thing: would you rather miss a few trades this week, or blow through three months of capital because you had no proof your plan worked? Every lesson you could learn for free on bar replay costs real money on a funded account. The market will still be there next week. Your account balance might not be.
"I already know how the strategy works. I watched the videos." Sound familiar? Understanding a concept and executing it under pressure are completely different skills. You can explain supply and demand zones perfectly on a whiteboard and still freeze when price taps into one on a live chart with money on the line. Knowing and doing are separated by reps. Backtesting is where those reps happen.
"Honestly, my rules kind of change depending on how I feel." If that is true, you do not have a plan to test yet. And that is fine. But be honest about it. Backtesting requires a documented, repeatable set of rules for entry, stop, and target. Build the plan first. That is a separate problem, and the common trading mistakes article covers several of the traps people fall into here.
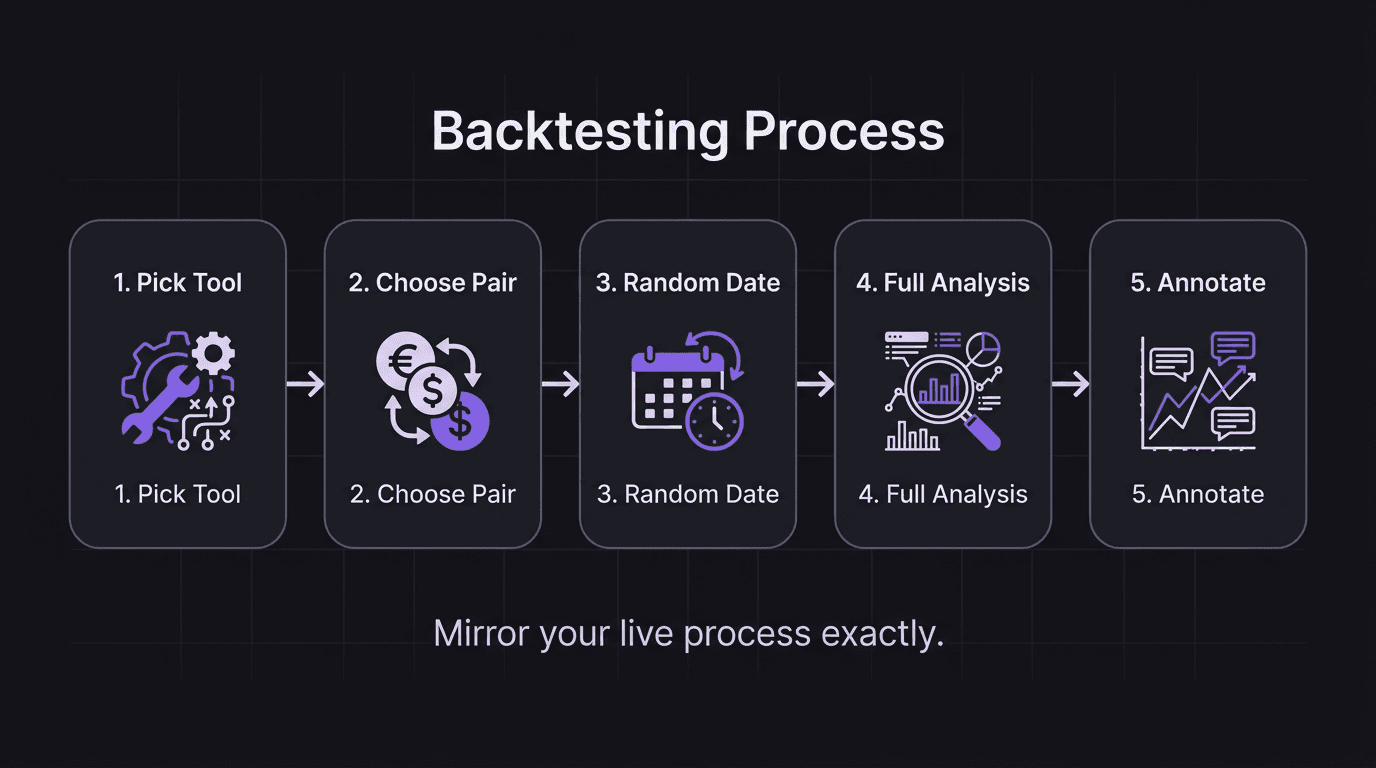
The Backtesting Process, Step by Step
This is a structured workflow. Not a casual scroll through old charts.
Pick Your Tool
TradingView's bar replay is the fastest free option. Open any chart, hit the replay button, and the chart flattens. Future price action disappears. You step forward one candle at a time.
Other options exist (Forex Tester, Soft4FX, custom Python scripts), but bar replay gets you testing in under a minute. No data imports. No configuration files. Just pick a pair and start.
Choose Your Pair and Session
Backtest the pairs you will actually trade live. If your watchlist is EUR/USD, GBP/USD, and USD/JPY, those are your backtest pairs. Do not waste hours on AUD/NZD if you will never have it on your screen at 7 AM.
Session matters just as much. If you trade the London kill zone, fast-forward through Asia. Testing setups during hours you will never be awake for produces data that has nothing to do with your real performance.
Go to a Random Starting Point
Scroll back to some random historical period. Do not pick a date where you already know the outcome. The randomness prevents confirmation bias from contaminating your sample.
This is harder than it sounds. Your brain wants to start on a week where "that big move happened on cable." Resist that.
Run Your Full Analysis
Start on the higher timeframe. Build your directional bias. What is the daily bias telling you? Mark your zones of interest on the medium timeframe. Then wait for price to reach your area.
When it does, drop to your entry timeframe and look for your specific model. This should mirror your live process exactly. Higher timeframe direction, medium timeframe level, lower timeframe trigger.
If you shortcut the analysis during backtesting, you will shortcut it live. Guaranteed.
Take or Skip, Then Annotate
Setup triggers? Take the trade. Criteria not met? Skip and keep stepping forward. Either way, annotate the chart. Mark what you saw, what you expected, and what actually happened.
Do not blow past this step. A trade that hit your target without you understanding why is almost as dangerous as an unreviewed loss. The annotations are where the actual learning lives.
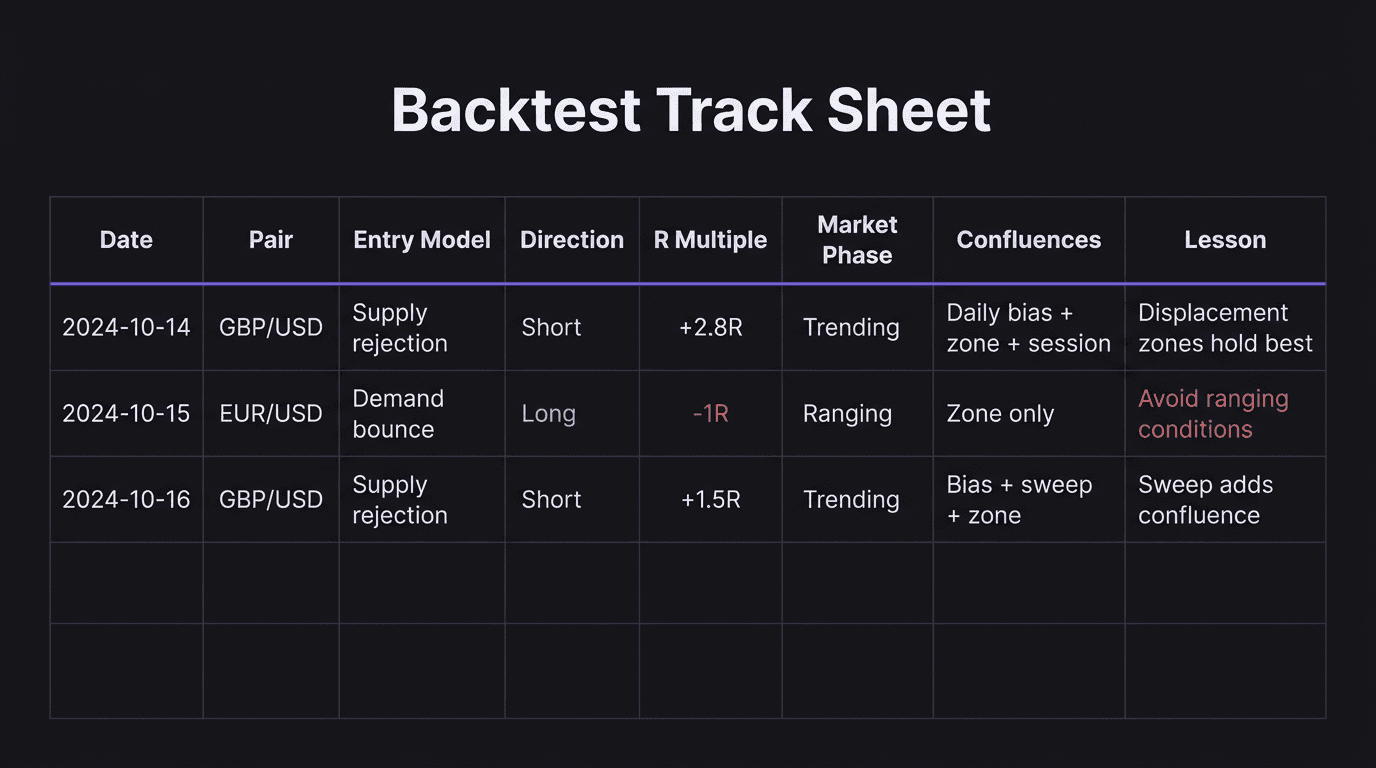
What to Record in Your Track Sheet
Your backtest log needs more detail than a live trade journal. This is where conviction data gets built.
Field | What to Record |
|---|---|
Date / Time | Historical date and session |
Pair | The pair tested |
Entry Model | Which specific trigger fired |
Direction | Long or short |
R Multiple | How many R gained or lost (+2.3R, -1R) |
Win / Loss | Binary |
Stop Loss Size | In pips, to track consistency |
Market Phase | Trending, ranging, volatile, choppy |
Confluences | What aligned: market structure, zone, session, liquidity sweep |
Screenshot | Annotated chart of the setup |
Key Lesson | One sentence on what this trade taught you |
When you hit 50 or 100 trades logged this way, patterns jump out that memory alone will never catch. You will see which entry models actually perform, which sessions give you clean setups, and which market conditions break your plan.
If you want structure for reviewing this data after the fact, a solid trading journal process makes a big difference.
How Many Trades Before You Trust It
Short answer: more than you think.
30 trades is the bare minimum for any pattern to emerge. Below this, variance dominates. Your "58% win rate" could easily be random.
50-100 trades gives you a real picture of win rate, average R, and performance across different conditions.
100+ trades is where genuine confidence forms. You have seen enough to know your edge is not a fluke.
If your win rate is below 50% after 50 trades, the plan needs work. Not more backtesting of the same broken rules. Go back, tighten your criteria, and test again from scratch.
And do not speed-run trades to hit a number. Fifty high-quality, fully annotated trades teach you more than 200 where you clicked through on autopilot. Would you rather have a small pile of gold or a warehouse full of gravel?
Walkthrough: Backtesting a Supply and Demand Entry on GBP/USD
Here is what a single backtest trade looks like in practice.
You are on TradingView bar replay, starting from a random Monday in October 2024. GBP/USD, 1-hour chart. You have already identified a bearish daily bias, and on the 1H you have marked a supply zone between 1.3045 and 1.3060, formed by a strong bearish displacement candle from two days ago.
You step forward candle by candle through the London session. Price grinds up slowly toward your zone. At 9:15 AM London time, the 15-minute chart shows price wick into 1.3052 and print a bearish engulfing candle. Your entry model triggers: displacement into zone, lower timeframe rejection, stop above the zone high at 1.3065.
You log the trade. Entry at 1.3048, stop at 1.3065 (17 pips risk), target at the previous premium/discount equilibrium around 1.3000 (48 pips, roughly 2.8R).
You step forward. Price drops through the London session, hits 1.3005 by early New York, and you close at target. Result: +2.8R.
You annotate the chart. Confluences: daily bearish bias, clean 1H supply zone, London session timing, 15M bearish engulfing confirmation. Lesson noted: "Zone held cleanly because it was formed by genuine displacement, not just a minor swing high."
That is one trade. One row in the spreadsheet. Forty-nine more to go before you have a sample worth trusting.
Walkthrough: The Mistake (Cherry-Picking and Rushing)
Now the version where it goes wrong.
Same trader, two weeks into backtesting, 22 trades logged. It is a Friday night and they want to hit 30 trades by the weekend. So they stop going to random dates. Instead, they scroll to a week in March 2024 where they remember GBP/USD dropped 200 pips, and they start from just before the drop.
Every short setup works. Obviously. They already knew the direction.
They also stop annotating. They click through the 15-minute confirmations quickly, log "win" in the spreadsheet, and move on. In 45 minutes, they log 12 more trades. Eleven are winners. Their spreadsheet now shows a 79% win rate across 34 trades.
Feels great. Means nothing.
When they go live the following Monday, the first three trades lose. Their actual win rate over two live weeks settles around 43%. The backtest data gave them false confidence because they poisoned the sample with cherry-picked dates and rushed annotations. They skipped trades that did not fit, did not record why setups failed, and never tested their plan during ranging or choppy conditions.
The fix: delete those 12 trades, go back to random dates, slow down, and annotate every trade as if a mentor is going to review it. Because in a sense, your future self is that mentor.
Backtesting vs Forward Testing vs Live
These three phases serve different purposes. Skipping any of them leaves a gap.
Phase | What It Proves | Time |
|---|---|---|
Backtesting | Your plan has a measurable edge on historical data | Weeks (your pace) |
Forward Testing | You can execute the plan in real-time conditions (demo or micro account) | Minimum 1 month |
Live Trading | You can execute under real financial and emotional pressure | Ongoing |
The order matters. Study and chart work come first, building your understanding of market structure and price action. Then backtesting to collect a large sample from your mechanical plan. Then forward testing for at least a month to prove real-time execution. Then live.
Forward testing and backtesting are not redundant. Ever clicked through a candle in two seconds on bar replay and thought "easy trade"? Then try sitting through those same 15 minutes in real time, watching it tick against you. That is what forward testing reveals. Backtesting gives you the statistical sample size that forward testing alone cannot match. You need both.
Going straight to live is the most expensive shortcut in trading. It is like skipping driving lessons and buying a sports car on day one. A solid pre-market routine helps with live execution, but the foundation has to be built here first.
Turning Backtest Data into Real Conviction
Conviction is not a mindset trick. It is a byproduct of evidence.
When you sit down to trade and you have 80 annotated backtest trades showing a 55% win rate with an average of 1.8R per winner, you do not need to psych yourself up. You have seen your setup play out across trending weeks, choppy weeks, news-heavy weeks. You know what it looks like when it works. You know what it looks like when it fails. And you know that three losses in a row is statistically normal for your system.
That is the difference between the trader who holds through a drawdown and the trader who panics after two red days. One has data. The other has hope. Hope is not a trading plan.
If fear is sabotaging your execution, the fastest fix is not a motivation video. It is a spreadsheet full of evidence that your process works.
How EdgeFlo Fits Into This Process
EdgeFlo's Edge Plan Builder lets you document your mechanical trade plan and keep it visible during every session. When that plan is backed by 80 trades of backtest data you collected yourself, discipline stops being about willpower. It becomes trust in a validated process.
The Trading Journal handles live trade logging automatically, importing executions and surfacing the same metrics you tracked during backtesting: win rate, average R, profit factor. No gap between your backtest spreadsheet and your live performance data.
The time spent on bar replay is not time away from making money. It is the cheapest tuition in trading.
The Edge Brief
Receive Insights on trading psychology, discipline, and the behavioral patterns that create consistent traders from our Founder and the EdgeFlo team, delivered to your inbox.
Think different. Trade different.
How do you backtest a trading strategy for free?
How many backtests do you need before going live?
What is the difference between backtesting and forward testing?
What should I record when backtesting?

Turn discipline on.
Every session.
EdgeFlo is the environment serious traders operate inside.
Start 7-Day Trial — $7
Cancel anytime.
No long-term commitment.


Think Different, Trade Different.