

Market Structure Trading: Find Who Controls Price
Market structure tells you who controls price right now. Learn to read highs and lows, spot structure shifts, and align every trade with the dominant side.

Market structure is the sequence of highs and lows that price prints on a chart, and it answers one question: who controls price right now? Higher highs and higher lows mean buyers are in control (bullish structure). Lower highs and lower lows mean sellers run the show (bearish structure). Every decision you make, from which direction to trade to where your stop goes, starts with reading this correctly. Get it wrong, and you are fighting the side that currently owns the market.
TL;DR
Market structure = the pattern of highs and lows. Higher highs/higher lows = bullish. Lower highs/lower lows = bearish.
Always trade in the direction of the dominant structure. Structure-aligned trades carry higher probability than counter-structure setups.
A break of structure (BOS) confirms the trend. A market structure shift (MSS) warns of a reversal.
Your invalidation is built in. If the strong low breaks on a long, or the strong high breaks on a short, exit. The structure told you the thesis is dead.
Read structure on a higher timeframe for bias, then drop lower for entries. Two timeframes, one direction.
Why Highs and Lows Are All That Matter
Strip away every indicator on your chart. What remains is price pushing up, pulling back, pushing again. Each push creates a high or low. Each pullback creates a temporary reversal. The relationship between those points (rising, falling, or flat) is market structure.
Think of it like tracking footprints. You don't need to see the animal. The direction and spacing of the prints tell you which way it went and how fast it was moving. Highs and lows are the footprints price leaves behind.
This matters because structure answers the most basic question in trading: is demand or supply winning? If you can answer that, you know which direction to trade and which supply and demand zones to trust.
Structure is not a strategy. It is the foundation every strategy sits on.
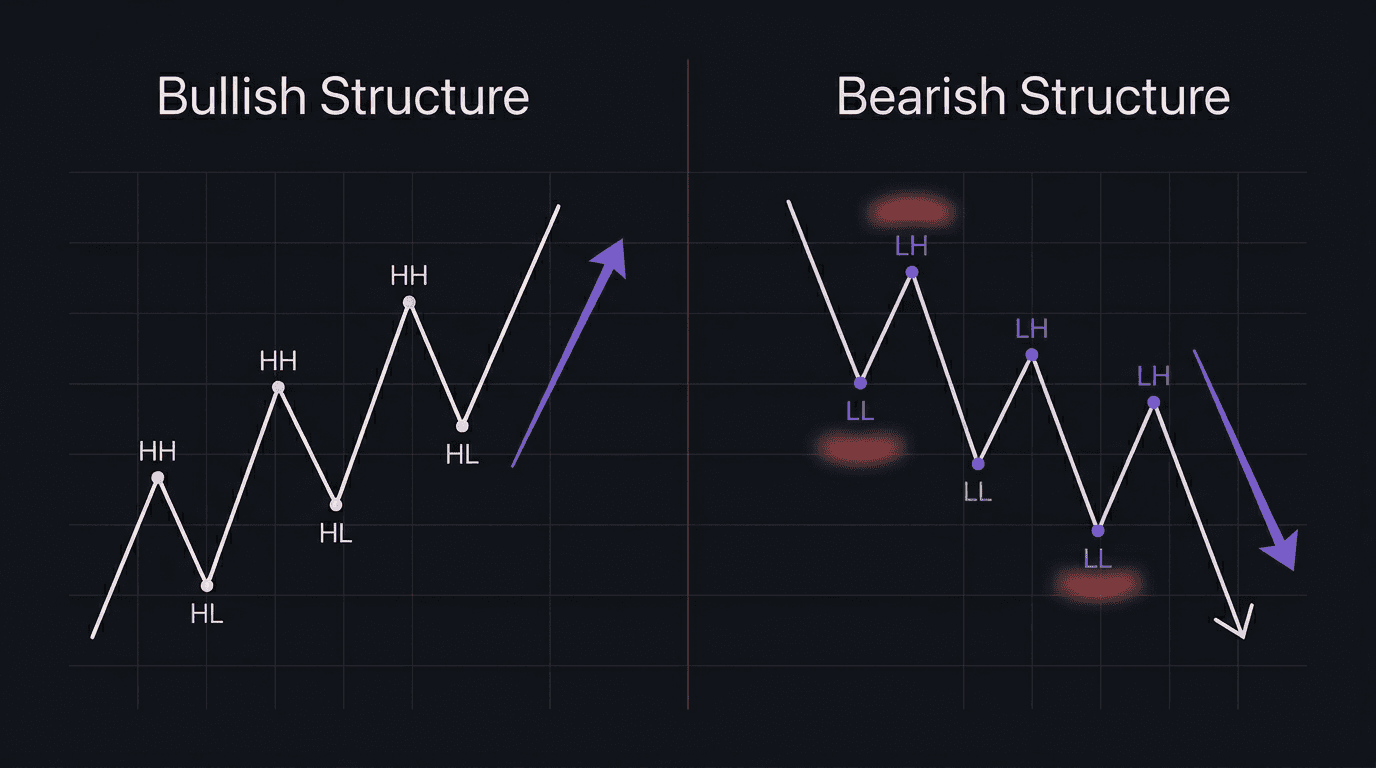
Bullish Structure: What to Look For
Two features define bullish structure:
Higher highs. Each rally pushes past the previous peak.
Higher lows. Each pullback holds above the previous pullback.
When this pattern is intact, buyers are stepping in at higher prices on every dip, and sellers keep failing to push below the last low.
Strong Lows and Weak Highs
In bullish structure, the higher lows are your strong lows. These are the levels where demand stepped in and drove price to a new high. As long as bullish structure holds, price should not break below them.
The swing highs? Those are weak highs. You expect them to get broken as price continues higher. That is why chasing price at the highs is risky. You want to enter near the discounted lows, in premium and discount zones that favor your risk-to-reward.
If you are holding a long, the most recent strong low is your structural invalidation. Price breaks it, your bullish thesis is gone.
Bearish Structure: The Mirror Image
Bearish structure flips everything:
Lower highs. Each rally fails to reach the previous peak.
Lower lows. Each decline pushes past the previous low.
Sellers are stepping in at lower prices on every rally. Buyers cannot hold the floor.
Strong Highs and Weak Lows
The lower highs become your strong highs (protected by the structure). The swing lows become weak lows (likely to get broken). In bearish structure, you sell at supply zones near the strong highs and expect demand zones near the weak lows to fail.
Buying in bearish structure means fighting the side that controls price. You can do it, but the probability is against you.
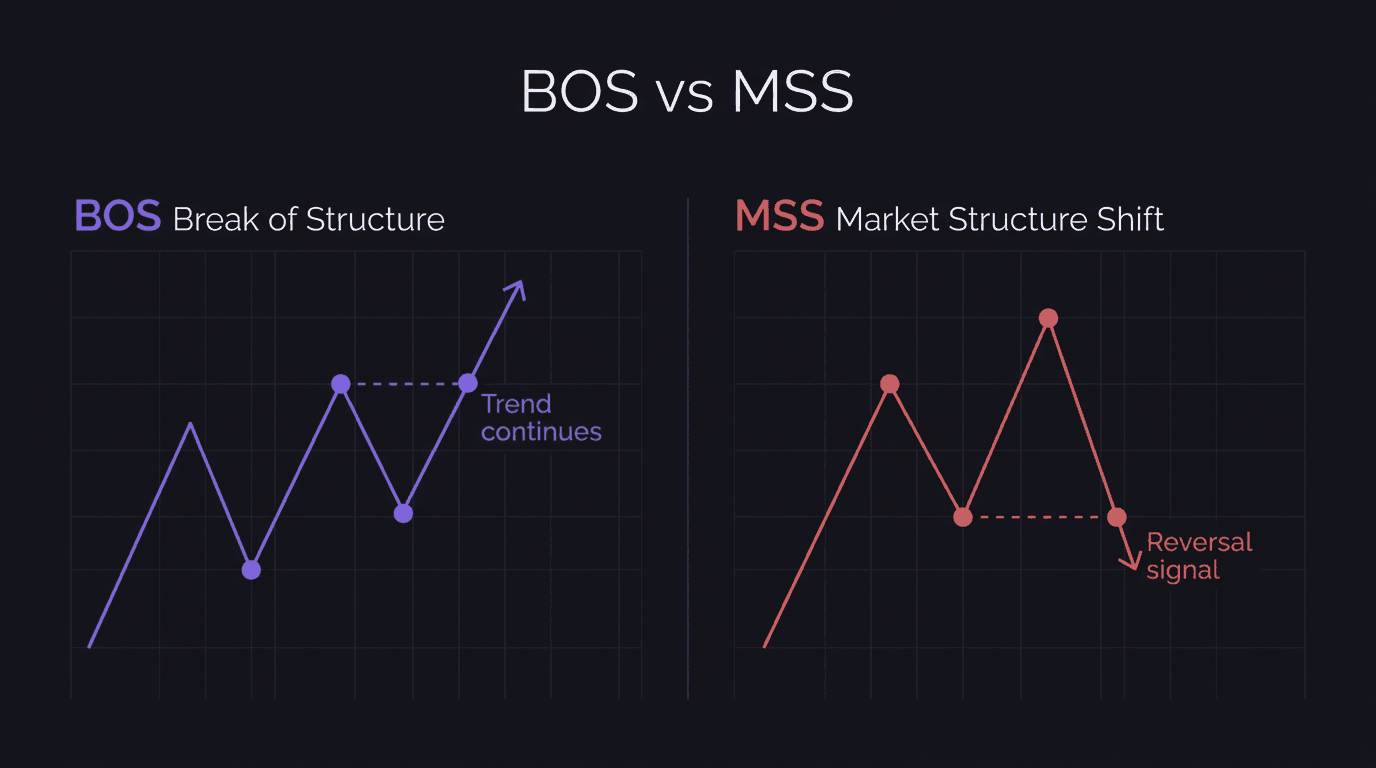
BOS vs. MSS: Know the Difference
Here's where most traders get confused. They see price break a level, call it a "shift," and flip their bias on the spot. Then they get run over because they confused a continuation signal with a reversal signal. These two events look similar on a chart, but they mean completely different things.
Break of Structure (BOS) | Market Structure Shift (MSS) | |
|---|---|---|
What it signals | Trend continuation | Potential reversal |
How it forms | Price breaks past a recent high (uptrend) or low (downtrend) in the trend's direction | Price breaks past the last strong high or low against the trend |
What it tells you | "The current side still has control." | "Control may be changing hands." |
The easiest way to think about it: a BOS is price doing what you already expected. Uptrend breaks a high? That's just the trend doing its job. Green light. Keep going.
An MSS is price doing something it shouldn't. A bullish market suddenly breaks below the last strong low? That's the alarm bell. The side that was losing just took a key level from the side that was winning.
Ever watched a tug-of-war where one team suddenly stumbles forward? That stumble is the MSS. The rope hasn't changed hands yet, but the balance just shifted.
What Happens After an MSS
So the shift happened. Now what? Most traders mess this up by jumping in the second the level breaks. That's chasing.
After a shift, price often pulls back toward the area where the break happened. That pullback, usually into a supply or demand zone near the break point, gives you an entry in the new direction. Waiting for the pullback is how you get a clean risk-to-reward instead of entering at the worst possible price.
And here's the part that saves accounts: not every MSS on a small timeframe means the bigger trend is reversing. A fractal-level shift might only signal an internal pullback. Always check the structure one level above before deciding the whole trend has flipped.
Walkthrough: GBP/USD Bullish BOS on the 1-Hour
The Setup
On February 18, 2026, GBP/USD was in bullish structure on the 1-hour chart. Price had printed a higher low at 1.2580, then rallied to a swing high at 1.2640. It pulled back to 1.2605, holding above the previous higher low, and started pushing up again.
What Happened
Price broke above 1.2640, clearing the previous swing high. That is a textbook break of structure: the trend continues. After the BOS, price pulled back to the 1.2635-1.2640 zone (the old resistance, now acting as support).
What the Trader Did
The trader entered long at 1.2638 on the pullback to the BOS level. Stop loss went below the most recent higher low at 1.2605. Target was the next logical resistance at 1.2685.
The Outcome
Price respected the zone and pushed to 1.2680 before stalling. The trader closed at 1.2678 for roughly 40 pips, risking 33. Clean 1.2R. The key was not chasing the break, but waiting for price to come back to the level where structure confirmed buyers were still in control.
Walkthrough: EUR/USD MSS Misread on the 15-Minute
The Setup
On February 21, 2026, EUR/USD had been bearish on the 1-hour chart (lower highs, lower lows). On the 15-minute chart, price bounced from 1.0440 and broke above the most recent 15-minute lower high at 1.0462.
The Mistake
The trader saw the 15-minute MSS and immediately entered long at 1.0464, thinking the trend was reversing. Stop loss below the swing low at 1.0438. But they never checked the 1-hour structure, which was still firmly bearish with a strong high at 1.0510 and no sign of a shift.
Why didn't they check the higher timeframe? Because the 15-minute chart looked convincing in isolation. And that's the trap.
What Actually Happened
The 15-minute "shift" was just an internal pullback within the 1-hour bearish leg. Price rallied to 1.0478, stalled at a 1-hour supply zone, and reversed hard. It blew through the stop at 1.0438 and continued to 1.0415.
The Lesson
A fractal or internal MSS does not override swing structure. Before trading an MSS, always ask: does the timeframe above confirm this, or is this just a pullback inside a larger move? The trader's 15-minute long was a counter-structure trade on the 1-hour. That is a low-probability bet. If they had checked the daily bias first, the 1-hour bearish structure would have kept them short (or flat).
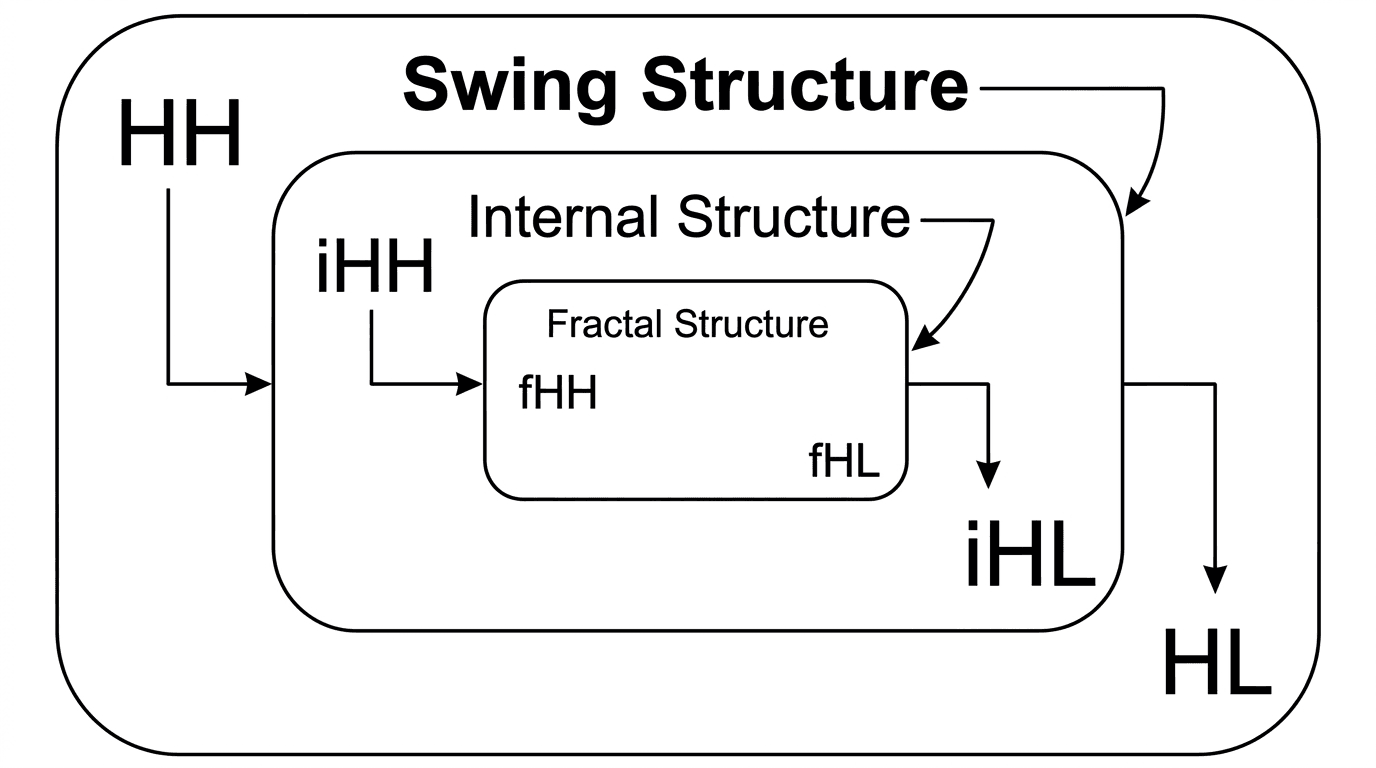
Swing, Internal, and Fractal: Three Layers
Market structure exists on multiple levels simultaneously. Understanding which level you are reading prevents a lot of bad trades.
Swing Structure
Swing structure is the big picture. Major highs and lows on your trading timeframe (daily, 4-hour). These peaks and valleys are obvious at a glance, and they define the overall trend. Swing structure changes slowly. When it shifts, something significant has changed.
Internal Structure
Internal structure is the movement between swing points. Price does not travel from a swing low to a swing high in a straight line. It creates smaller highs and lows along the way. These help you time entries within the larger trend: if swing structure is bullish, internal structure tells you where pullbacks end.
Fractal Structure
Fractal structure is the micro-layer inside internal moves. Most relevant for scalpers and lower-timeframe traders.
The critical idea: these layers nest. A fractal MSS can signal the start of an internal pullback. An internal MSS can signal a swing-level reversal. Always know which level you are looking at and what it implies for the level above.
Building Structure Into Your Trading Plan
Reading structure is a skill. Using it consistently requires a process. How many times have you read the structure correctly, then ignored it and taken the trade anyway?
Mark Your Levels Each Session
Before you trade, spend five minutes as part of your pre-market routine. Identify the most recent swing high and swing low. Are they forming higher highs/lows or lower highs/lows? Mark the strong levels (the ones that would invalidate the current structure if broken).
Set Your Bias
Based on structure, decide: longs, shorts, or sit out. This is your daily bias. If structure is unclear (consolidating or mid-shift), waiting is a valid decision. Forcing a bias when the chart gives you nothing is how you end up on the wrong side.
Align Entries With Structure
The highest-probability trades go with the prevailing structure. Bullish structure: buy pullbacks to demand. Bearish structure: sell rallies to supply. Counter-structure trades are not inherently wrong, but they carry lower odds and demand tighter risk.
If you track this in a trade journal, you will likely find your win rate on structure-aligned trades is noticeably higher. The data makes the case better than any article can.
Know Your Invalidation
Every trade needs a "I was wrong" level. Structure-based trading hands you that level for free. If the strong low breaks on your long, the structure has changed. If the strong high breaks on your short, same thing. Exit. No ambiguity, no hoping.
That clarity is one of the biggest advantages of this approach. The market tells you when your thesis is dead. You do not need to guess.
Structure and Supply/Demand Zones
Market structure and supply and demand zones work together. Structure tells you the direction. Zones tell you the location.
Trust demand zones near the strong lows. Buyers defended these levels before and likely will again.
Be skeptical of supply zones at the weak highs. Structure favors buyers blowing through them.
Trust supply zones near the strong highs. Sellers have control.
Be skeptical of demand zones at the weak lows. These are likely to get swept.
This is also where liquidity sweeps come into play. Price often dips below a strong low to grab the stop losses sitting there, then reverses and continues with the structure. Recognizing that pattern prevents you from getting stopped out at the worst possible moment.
When structure and zones conflict (for example, price reaches a demand zone but structure has shifted bearish), structure wins. The zone might hold temporarily, but the odds favor the structural direction. Backtesting this framework across different conditions builds conviction.
How EdgeFlo Supports Structure-Based Trading
EdgeFlo's Edge Plan Builder lets you write out your market structure rules and keep them visible next to your chart during the session. When the rules are staring at you, it is harder to take that counter-structure impulse trade.
The Dashboard tracks your win rate on bullish vs. bearish setups and on structure-aligned vs. counter-structure trades. Instead of guessing where your edge lives, you see it in the numbers. That feedback loop is how process turns into consistency.
The Edge Brief
Receive Insights on trading psychology, discipline, and the behavioral patterns that create consistent traders from our Founder and the EdgeFlo team, delivered to your inbox.
Think different. Trade different.
What are the 4 types of market structure?
What is the difference between BOS and MSS?
Does market structure work on all timeframes?
What is the 3 5 7 rule in trading?

Turn discipline on.
Every session.
EdgeFlo is the environment serious traders operate inside.
Start 7-Day Trial — $7
Cancel anytime.
No long-term commitment.


Think Different, Trade Different.