

Liquidity Sweeps: Stop Getting Trapped by Fakeouts
A liquidity sweep runs price through stop orders at a key level, then reverses. Learn how to identify sweeps on a chart and use them as entry confirmation.
A liquidity sweep is a price move that pushes through a key level (prior day high, equal lows, swing point) to trigger the stop orders sitting there, then reverses. Large participants need those stop orders to fill their positions. When price breaks a level and immediately rejects, that is a sweep. It does not guarantee a reversal, but it tells you a pool of orders has been consumed and the market may be ready to move the other direction.
Once you see this, breakouts look different. Instead of chasing every push through a level, you start asking: was that real, or did price just grab the liquidity it needed?
TL;DR
A liquidity sweep runs through stop orders at a key level, then reverses. It is not a breakout. It is fuel collection.
Sweeps happen at predictable spots: prior day high/low, equal highs/lows, and obvious swing points where stops cluster.
Never trade the sweep alone. Wait for a market structure shift after the sweep to confirm reversal.
Combine sweep + bias + structure shift for the highest-probability entries.
Track your sweep setups separately so you know your actual win rate on this pattern.
What a Liquidity Sweep Actually Is
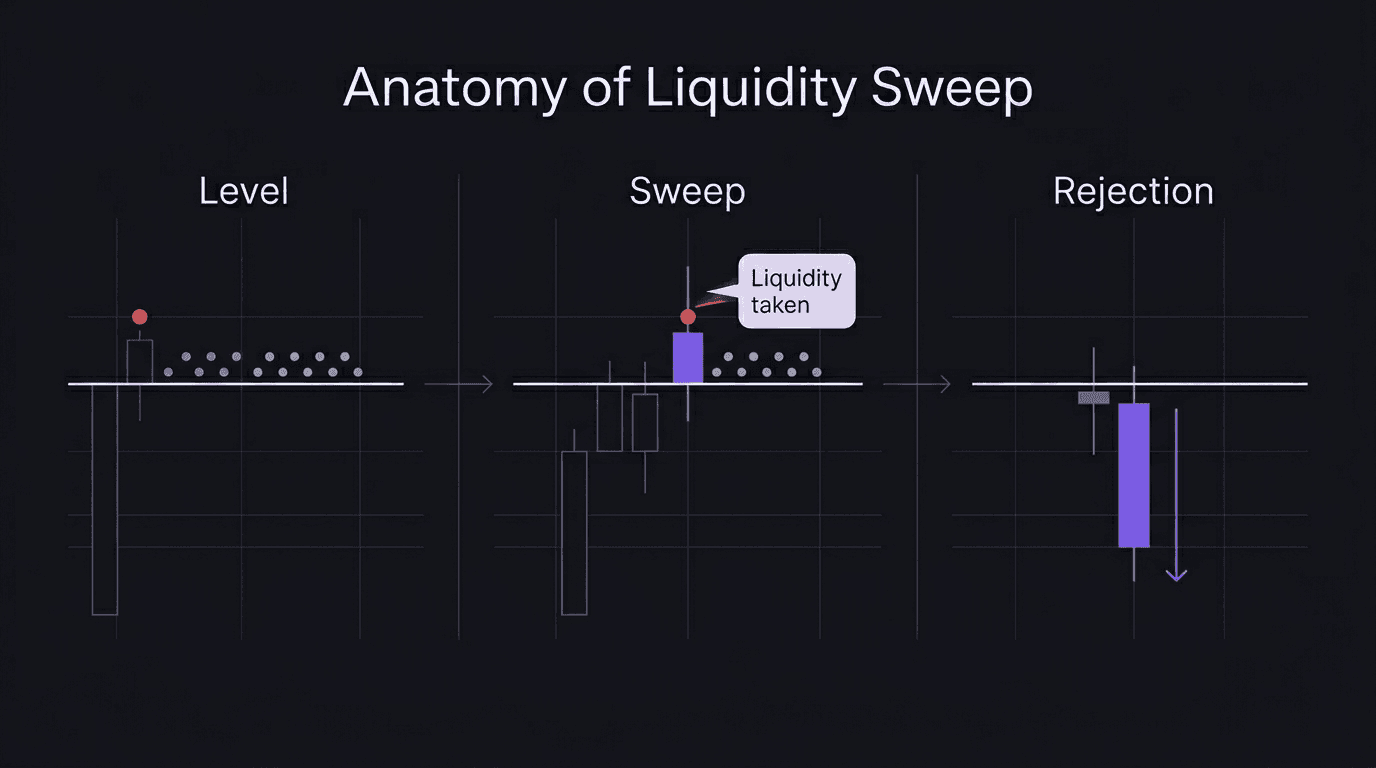
Price moves past a level where stop-loss orders are clustered, fills those orders, and pulls back. The key word is "sweep." Price does not stay beyond the level. It runs through, collects the orders, and returns.
Stop orders cluster in predictable places. Above recent swing highs. Below recent swing lows. At the prior day's high and low. At equal highs or equal lows. These clusters are liquidity pools.
Liquidity as fuel
Think of a car sitting in your driveway. You want to drive across the state, but the tank is empty. You are not going anywhere until you fill up. The market works the same way.
A large buyer cannot fill a massive order without sellers on the other side. Where do they find sellers? At the exact levels where retail traders have stop-loss sell orders sitting. When price sweeps above a swing high, it triggers those stops. The stop-loss orders execute as market sells, which give the large buyer the fuel to fill their position. No fuel, no move.
Quick example: price forms three equal highs at 1.0850 on EUR/USD. Shorts place their stops just above, around 1.0855. Price pushes to 1.0858, triggers those stops. The stop orders execute as market buys, giving an institutional seller the liquidity to fill a short. Price reverses sharply below 1.0850.
That move above 1.0850 was not a breakout. It was a fill-up at the gas station.
Where liquidity pools form
Two types show up constantly:
Prior day high and low. The previous session's high and low are some of the most-watched levels in any market. Stops stack on both sides. A sweep of the prior day high clears the shorts. A sweep of the prior day low clears the longs.
Equal highs and equal lows. When price prints two or three highs at nearly the same price, traders read it as resistance and place stops just above. But equal highs are not resistance. They are a pool of stop orders waiting to be swept. Same with equal lows. Not support. Fuel.
Why Sweeps Happen
This is order flow mechanics, not some market conspiracy.
A retail trader placing a 0.5-lot order gets filled instantly without moving price. An institution looking to fill 500 lots? Completely different problem. If they hit the market with a 500-lot buy, they would push price up against themselves and get a terrible average fill.
So large participants look for areas where opposing orders are stacked. Those opposing orders are the stop losses of other traders. By allowing price to reach those clusters, the large participant fills their order at a favorable price with minimal slippage.
Price gravitates toward liquidity because that is where the orders are. It is how markets work at scale.
How this connects to market structure
Liquidity sweeps tie directly into market structure. A sweep on its own is just a target being hit. What happens after (the structure that forms) tells you whether the market is actually reversing or just pausing before continuing.
A sweep alone is not a trade signal. It is one piece of a larger confirmation process.
Sweep vs. Grab: Does It Matter?
You will hear both terms thrown around in trading communities. There is a practical difference, but it is small.
Liquidity Sweep | Liquidity Grab | |
|---|---|---|
Price action | Quick wick through the level, closes back on the other side | Can close beyond the level briefly before reversing |
Speed | Fast, often a single candle wick | May take 2-3 candles |
Confirmation | Rejection is immediate | Rejection develops over a few candles |
Both tell you the same thing: the liquidity at that level has been consumed. A sweep is cleaner. A grab is messier. For trading purposes, treat both as "liquidity has been taken." What matters is not the label. It is what happens next.
How to Identify a Liquidity Sweep on a Chart
Three things to look for: the level, the move, and the reaction.
Step 1: Mark the liquidity levels
Before the session starts, mark the obvious pools:
Prior day high and low
Prior week high and low
Equal highs and equal lows (two or more touches at the same price)
Swing highs and swing lows on your execution timeframe
If you are trading during the London or New York kill zone, focus on the levels most likely to be targeted during that session. Price in the Asian session often builds the liquidity that London sweeps.
Step 2: Watch for the run
A sweep looks like this on the chart:
Price approaches a marked level
Price pushes through the level, often with a sharp move or a long wick
The candle body closes back on the other side of the level
On a 15-minute chart, a textbook sweep shows price wicking above the prior day high by 5-10 pips, then closing below it on the same candle or the next one.
Step 3: Confirm the rejection
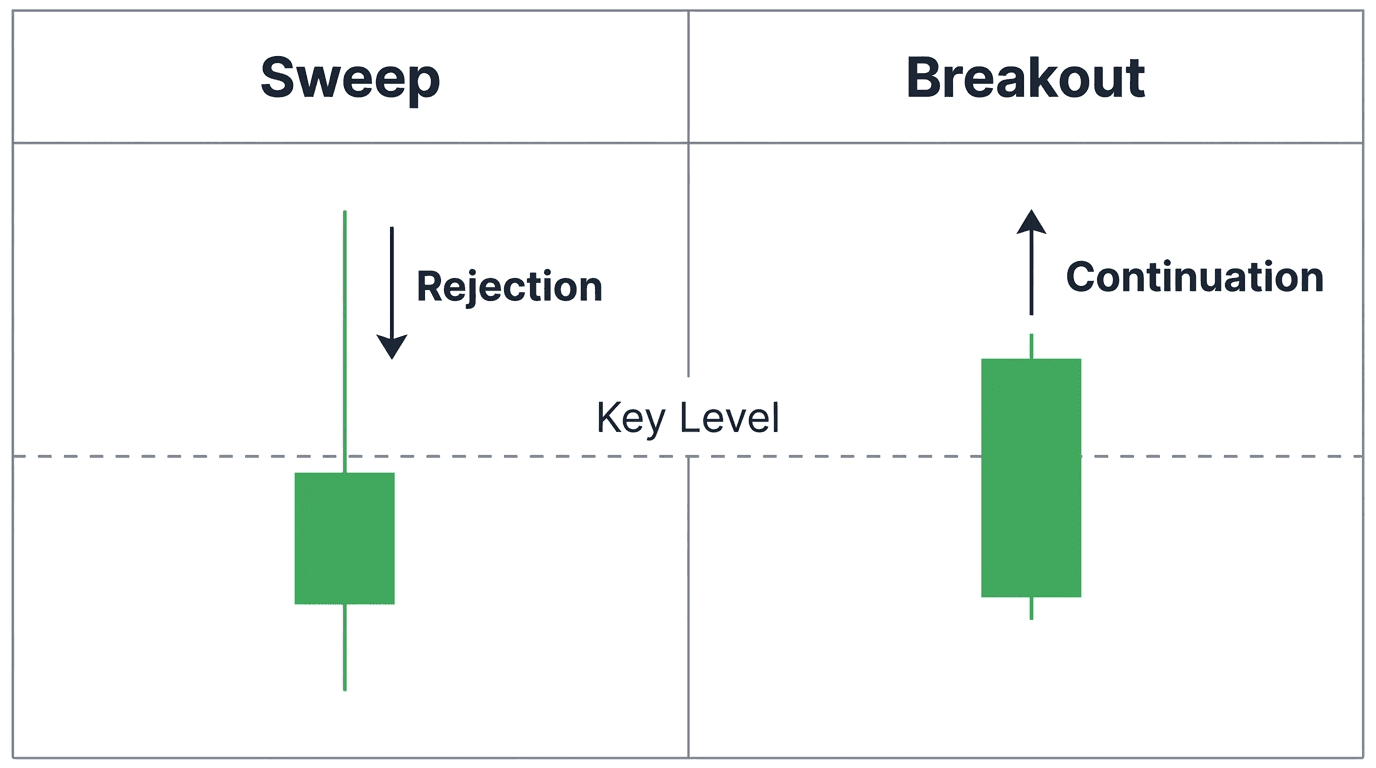
The rejection separates a sweep from a genuine breakout. Look for:
A long wick through the level with a close back below/above it
Strong momentum in the opposite direction on the following candle
A break of structure on the lower timeframe confirming the reversal
Without rejection, it might not be a sweep. It might just be a breakout. Wait for price to tell you.
Walkthrough: GBP/USD sweep during London open
> You are watching GBP/USD on a 15-minute chart during the London session. The Asian session printed equal lows at 1.2600, with three touches at that level. You mark it as a liquidity pool and set an alert. > > London opens at 8:00 AM GMT. Within the first 30 minutes, price drops sharply to 1.2594, sweeping those equal lows by 6 pips. The stop-loss orders of traders who were long from 1.2600 get triggered. > > Then a bullish engulfing candle forms on the 15-minute chart, closing back above 1.2605. You drop to the 5-minute chart and see a break of the most recent swing high, confirming a structure shift. You enter long at 1.2608 on the retest of the broken structure level. Stop goes below the sweep wick at 1.2590 (18 pips risk). > > Price runs to the prior day high at 1.2660, hitting your 1:2.8 reward-to-risk target. The sweep gave you the location. The structure shift gave you the trigger.
That sequence (sweep of lows, rejection candle, break of structure) is what a complete sweep confirmation looks like.
Using Sweeps as Entry Confirmation
A liquidity sweep is not a standalone entry trigger. It is a confirmation layer. You need it combined with other pieces.
Ever watched price sweep a level and entered immediately, only to see it keep going? That is what happens when you treat the sweep as the whole signal instead of one part of a three-part check.
The three-part confirmation stack
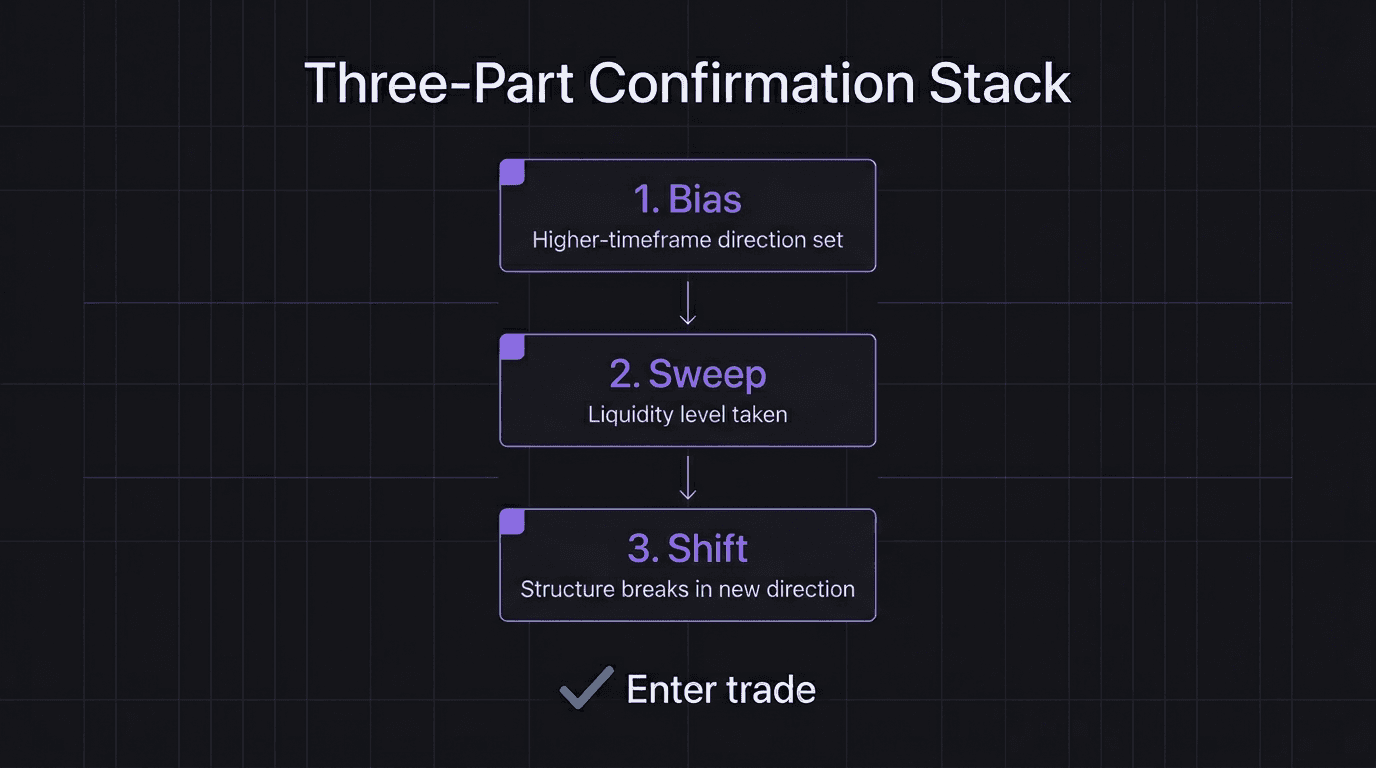
The strongest sweep-based entries combine:
Bias. You have a directional bias from higher-timeframe analysis. If price is in a discount zone, you are looking for buys. If it is in a premium zone, you are looking for sells.
Sweep. Price sweeps a liquidity level that aligns with your bias. In a discount, you want a sweep of lows. In a premium, a sweep of highs.
Shift. After the sweep, you see a market structure shift, a break of structure confirming the reversal. Think of it like an assembly line: the sweep collects the raw material, but the shift is the signal that the factory is running.
Without all three, the setup is incomplete. A sweep without a shift means the target was hit, but there is no evidence of reversal. A shift without a sweep means the market turned, but it may not have cleared enough liquidity to sustain the move.
Putting the strategy together
Identify your daily bias using higher-timeframe structure and key levels
Mark the liquidity pools that align with your bias direction
Wait for price to sweep the target level
Drop to a lower timeframe (1-minute or 5-minute) and watch for a break of structure
Enter on the retest of the broken structure level
Place your stop loss beyond the sweep wick
Target the next liquidity pool in the opposite direction
You define the criteria before the session, then wait for all three boxes to check. No chasing. No guessing.
What a sweep does NOT tell you
A sweep does not guarantee reversal. Price can sweep a level and keep going. This happens when stronger institutional interest sits on the continuation side, or when the sweep occurs against the dominant trend.
That is why you never trade the sweep alone. You wait for the shift. If it does not come, you do nothing. Sound boring? Good. Boring is profitable.
The Mistake That Costs Most Beginners
How many times have you seen a wick through a level and thought, "That is my entry"?
> You are watching EUR/USD during the New York session. Price has been grinding higher all morning and approaches equal highs at 1.1040. You have been reading about liquidity sweeps and you are excited to try one. > > Price pushes above 1.1040 to 1.1047, and you think: "That is a sweep of highs. Time to short." You enter short at 1.1043 without waiting for a break of structure on the lower timeframe. > > But price does not reverse. It pulls back to 1.1038 briefly (giving you hope) then rips higher to 1.1075. Your stop at 1.1055 gets hit for a 12-pip loss. > > What went wrong? Two things. First, the higher-timeframe trend was bullish, so shorting a sweep of highs was fighting the trend. You had no daily bias supporting a sell. Second, you did not wait for a market structure shift on the 5-minute chart. The sweep happened, but the shift never came. > > The sweep was real. The liquidity at 1.1040 did get taken. But the market used that liquidity to fuel continuation, not reversal. No bias alignment, no structure shift, no trade.
This is the single most common sweep mistake. The sweep happened. The trader entered. But two of the three confirmation pieces were missing.
Common Sweep Trading Mistakes
Trading every sweep you see
Not every sweep leads to a reversal. Some sweeps are just the market collecting fuel before continuing in the same direction. If you enter on every sweep without confirmation, your win rate will drop. Always wait for the break of structure.
Marking too many levels
If every minor swing high and low is a "liquidity level," then every candle becomes a "sweep." Be selective. Focus on the levels with the highest concentration of stops: prior day high/low, equal highs/lows, and clean swing points that are obvious to every participant on the chart.
Ignoring higher-timeframe context
A sweep of highs in a strong uptrend is not the same as a sweep of highs at a premium zone in a ranging market. Context determines whether a sweep leads to reversal or continuation. Check your supply and demand zones and higher-timeframe structure first.
Moving stops too tight after entry
After entering on a sweep confirmation, your stop needs to sit beyond the sweep wick. Tighten it below the wick to reduce risk and you will likely get stopped out by a retest of the sweep level. That retest is normal. Expect it.
Tracking Your Sweep Setups
If you are trading sweeps but not tracking results separately, you have no idea whether this pattern actually works for you. What is your win rate on sweeps with full confirmation versus partial confirmation? Do your sweep entries perform better on specific pairs or sessions?
Tag your sweep trades in your trading journal. After 20-30 samples, you will know your actual edge on this setup. Without that data, you are guessing.
Backtesting sweep setups on historical charts is another way to build conviction before risking real capital. Mark the levels, replay the price action, record the results.
How EdgeFlo Supports Sweep Trading
EdgeFlo's journal lets you tag specific setup types, including sweep entries, so you can filter and review them separately. After a few weeks of tagging, you can pull up every sweep trade you have taken and see your actual numbers: win rate, average R, and how confirmation quality affected the outcome.
The Replay feature also helps with backtesting sweep setups. You can step through historical price action candle by candle, practice identifying sweeps, and track your hypothetical results before putting real money on the line.
The Edge Brief
Receive Insights on trading psychology, discipline, and the behavioral patterns that create consistent traders from our Founder and the EdgeFlo team, delivered to your inbox.
Think different. Trade different.
What is a liquidity sweep?
Is a liquidity sweep bullish or bearish?
Are liquidity sweeps real?
What is the difference between a liquidity grab and a liquidity sweep?

Turn discipline on.
Every session.
EdgeFlo is the environment serious traders operate inside.
Start 7-Day Trial — $7
Cancel anytime.
No long-term commitment.


Think Different, Trade Different.