

Daily Bias Trading: 5-Step Checklist to Pick Direction
Build your daily bias in 10 minutes with this 5-step checklist. Mark the trend, find premium/discount, spot liquidity, write your narrative, and set invalidation.
What Daily Bias Actually Means (And Why You Need One)
Daily bias trading is how you decide where price is most likely headed over the next session, and why. You look at market structure, key levels, and a clear invalidation point, then write it down before the open. If your bias has no invalidation, you don't have a plan. You have a guess dressed up as confidence.
Think of it like checking the weather before you leave the house. You wouldn't walk out the door without knowing if it's going to rain. Your daily bias is the same thing for your trading session: a quick read on conditions so you know what to prepare for.
Without a directional filter, you react to every candle. You chase. You flip long to short mid-session because a red candle spooked you. A daily bias stops that cycle. It tells you which setups to look for and which to walk away from.
TL;DR
Your daily bias comes from the daily and 4H charts, not the 5-minute. Lower timeframes show noise, not direction.
Buy in discount, sell in premium. If price is sitting at the 50% equilibrium of the range, there's no edge. Wait.
Pick one target per session. Not three. One liquidity level, one prior day high/low, one imbalance.
Write a one-sentence narrative before the open. If you can't explain your bias in one sentence, you don't have one yet.
Define invalidation or you'll hold a losing bias all day. A specific price level or event that proves you wrong, written down before you trade.
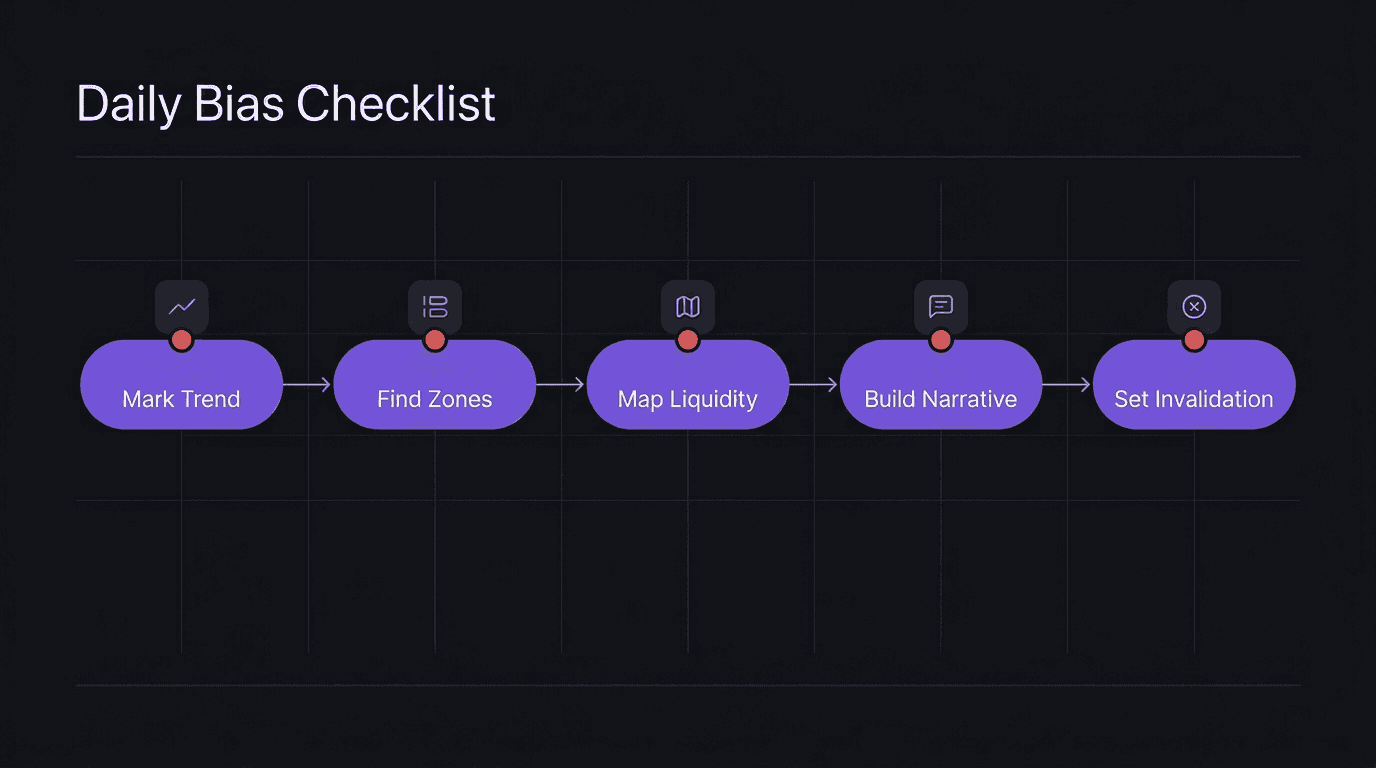
The 5-Step Daily Bias Checklist
Most traders skip bias work entirely. Others try to form a view on a 5-minute chart, which is like judging a movie by one frame. Both approaches fall apart fast. A reliable daily bias comes from working top-down through higher timeframes and narrowing your focus before the session starts.
Mark the higher timeframe trend
Identify premium and discount
Mark liquidity and prior day levels
Build your narrative
Define your invalidation
Each step feeds the next. Skip one and the framework breaks down.
Step 1: Mark the Higher Timeframe Trend
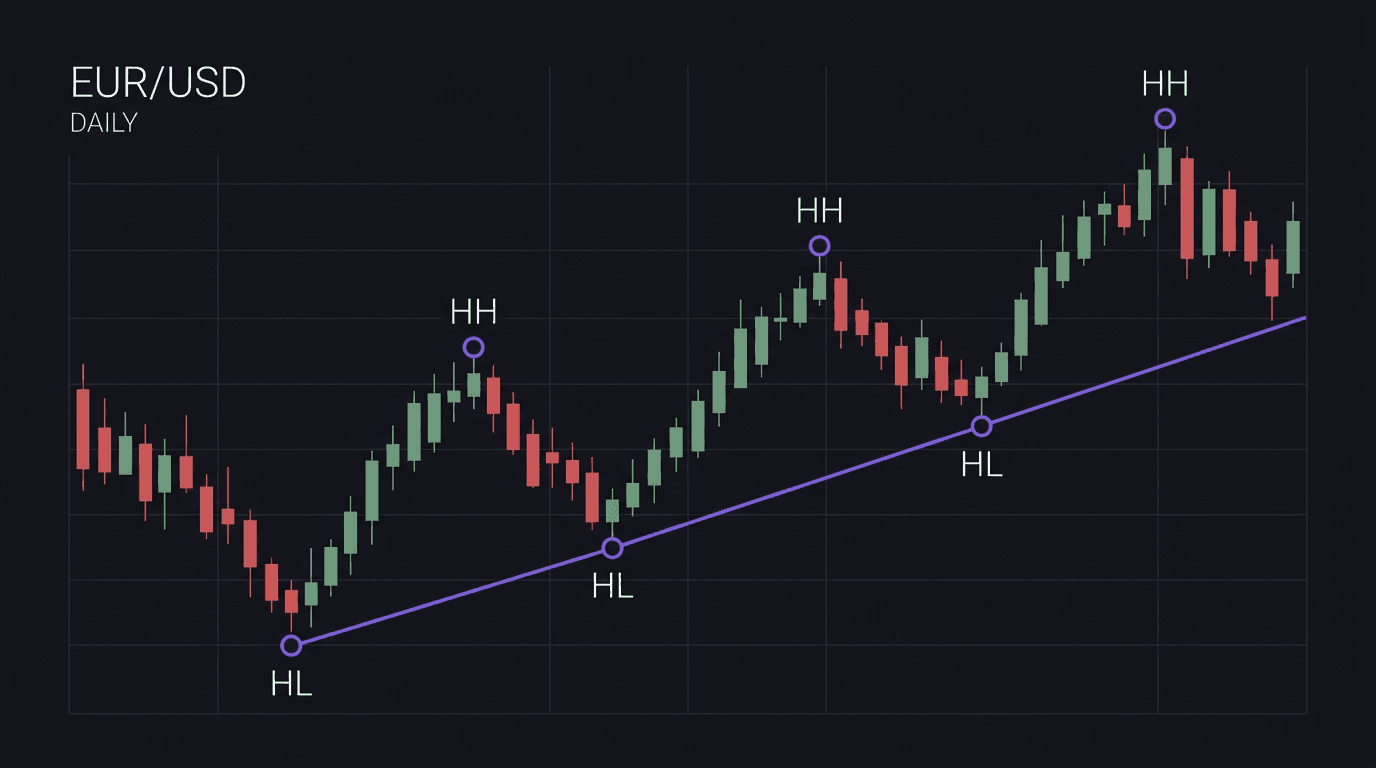
Open the daily or 4H chart. Find the most recent swing high and swing low. That's your swing range.
Now ask one question: is price making higher highs and higher lows, or lower highs and lower lows? The answer gives you your directional lean.
Daily is bullish? Look for longs.
Daily is bearish? Look for shorts.
Structure is choppy or unclear? Stay flat. No edge in forcing a read on a messy chart.
This single filter eliminates a huge chunk of bad trades before they happen. Instead of scanning every pair on every timeframe, you narrow to the directions that align with the higher timeframe structure.
If you're building a pre-market routine, this is the first field you fill in every morning.
Step 2: Identify Premium and Discount
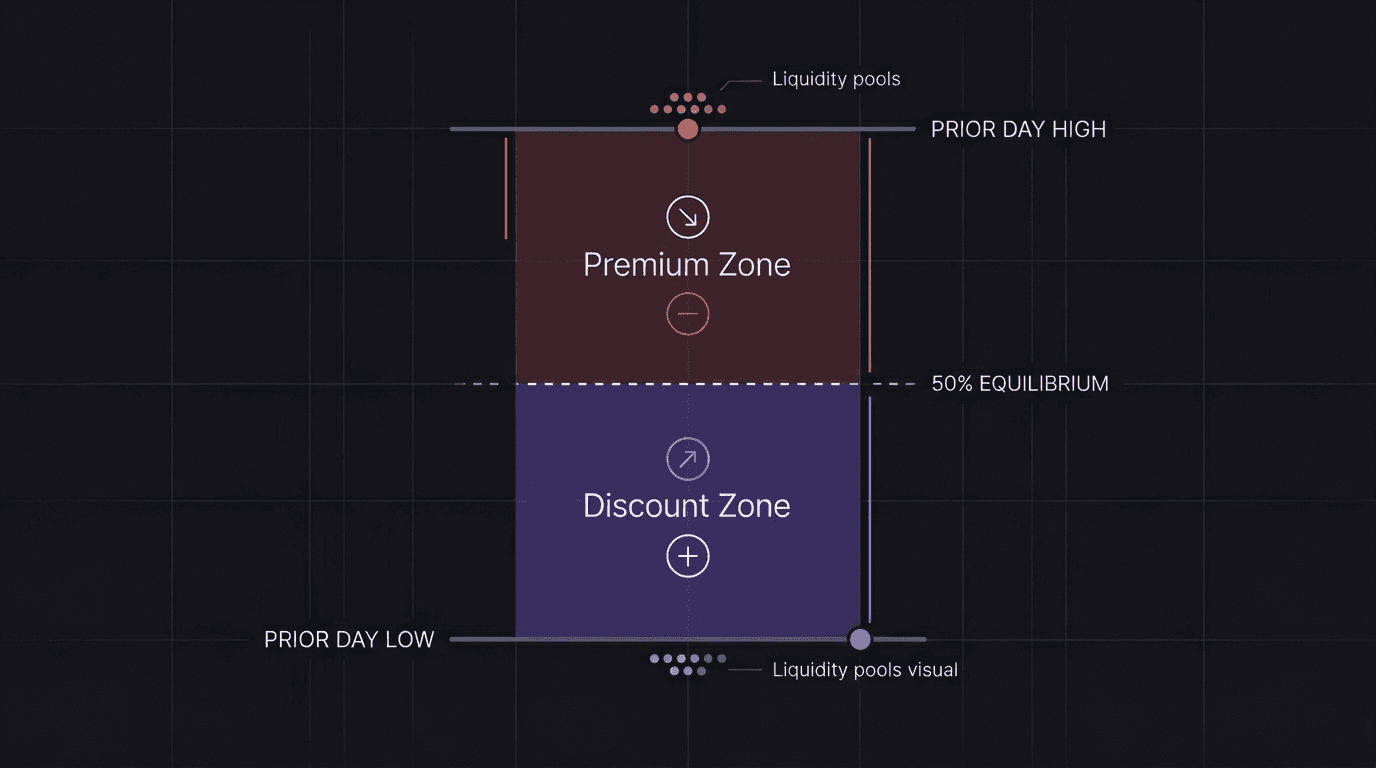
Once you have the swing range, apply a Fibonacci retracement from the swing low to the swing high (or high to low for bearish structure). The 50% level is your equilibrium.
Above 50% = premium zone. Price is expensive. Look for sells if your bias is bearish.
Below 50% = discount zone. Price is cheap. Look for buys if your bias is bullish.
At or near 50% = no-trade zone. You're in the middle. There's no statistical advantage here. Wait.
Ever bought something full price, then watched it go on sale the next day? That sting is what trading in premium feels like when your bias is bullish. You want to buy cheap and sell expensive. Premium and discount zones are foundational to this work. Trading in the middle of the range is one of the most common reasons traders chop themselves up all week and wonder where the money went.
Step 3: Mark Liquidity and Prior Day Levels
Liquidity is where stop losses cluster. Equal highs, equal lows, prior day highs, prior day lows: these are magnets. Price tends to seek them out before reversing or continuing.
What to Mark
Prior day high and low. The most-watched levels in intraday trading. They represent the full range of the previous session.
Equal highs or equal lows. Two or more swing points resting at nearly the same price. These signal resting liquidity above or below.
Unfilled imbalances. Areas where price moved aggressively without revisiting the other side. These often act as targets.
Understanding how liquidity sweeps work helps you anticipate where price is going rather than reacting after it arrives.
Pick One Target
Not three. Not five. One. Your daily bias needs a single destination: the prior day high, the prior day low, an opposing zone, or an unfilled imbalance. One target keeps your plan simple and your execution clean.
Step 4: Build Your Narrative
Now connect the dots. You have a trend direction, a price zone, and a target. Your narrative is the one-sentence story linking all three.
Two Basic Narrative Types
Continuation. Price pulled back into a discount zone within a bullish trend. You expect it to push higher toward the prior day high or a liquidity pool above.
Reversal/pullback. Price swept liquidity at a key level and internal structure is shifting. You expect a move in the opposite direction toward the next significant level.
Your narrative should be one or two sentences. Something like: "Daily trend is bullish. Price is sitting in discount below the 50% fib. I expect a move up to sweep the equal highs at 1.0950."
Stick to Your Direction
This is where discipline matters. If your narrative says longs, only take long setups. If the 5-minute chart dangles a short in front of you, ignore it.
Ever been in a grocery store, list in hand, and grabbed something random off the shelf just because it caught your eye? That's what taking a counter-bias trade feels like. It wasn't on the list. It probably won't end well.
Alignment between your bias and your entries separates a disciplined process from gambling on every candle.
Step 5: Define Your Invalidation
This is the step most traders skip. And it's the most important one.
Your invalidation is a specific condition that proves your bias wrong. Not "if it goes against me." A concrete, pre-defined event. Write it down before the session opens.
Examples:
"My bullish bias is invalid if price closes below 1.0880 on the 1H chart."
"My bearish bias is invalid if price sweeps the low and immediately reclaims it with a strong displacement candle."
"My bias is invalid if price breaks above the swing high I used for my fib."
Without invalidation, you'll hold a losing bias all day. You'll add to losers. You'll revenge trade because the market proved you wrong and you never defined what "wrong" looks like.
Invalidation is not admitting defeat. It's risk management.
Walkthrough: A Good Bias Read on EUR/USD
The Setup (March 2025, London Open)
You sit down at 7:30 AM GMT. On the EUR/USD daily chart, price has been making higher highs and higher lows for two weeks. Clear bullish structure. You pull a fib from the most recent swing low (1.0820) to the swing high (1.0960).
Price is sitting at 1.0870, well below the 50% level (1.0890). That puts it in discount. You mark the prior day high at 1.0935 and notice equal highs from two sessions ago at 1.0950.
Your narrative: "Daily trend is bullish. Price is in discount below equilibrium. I'm looking for longs targeting the equal highs at 1.0950. Bias is invalid if price closes below 1.0820 on the 1H."
London opens. Price dips to 1.0865 (a liquidity sweep of the Asian session low), then prints a bullish displacement candle on the 15-minute. You enter long at 1.0878 with a stop below the sweep at 1.0858.
Outcome: Price rallies through the London session and reaches your take profit at 1.0950, right at those equal highs. You close at 1.0950. The bias, the zone, the target, and the timing all aligned.
The checklist took 10 minutes. The trade managed itself because the plan was already written.
Walkthrough: A Bad Bias Read on GBP/USD
The Mistake (February 2025, New York Open)
You check GBP/USD on the daily chart. Price made a lower low two days ago, but yesterday printed a strong bullish engulfing candle. You feel bullish. The candle looks convincing. You skip the fib, skip marking liquidity, and write down "bullish bias, targeting 1.2700."
No discount confirmation. No specific invalidation. Just a gut read off one candle.
New York opens. Price pushes up to 1.2665, stalls, then drops hard. You're holding a long from 1.2640 with no invalidation defined, so you keep holding. "It'll come back." It doesn't. Price closes the session at 1.2590. You take a 50-pip loss that should have been 20.
Ever done this? Held a trade way past the point where your gut already knew it was wrong, just because you never wrote down what "wrong" actually looked like?
What went wrong:
No premium/discount check. Price was actually sitting at the 61.8% retracement of the recent swing, deep in premium territory. Buying in premium during a bearish trend is a coin flip at best.
No real invalidation. "I'll know when I see it" is not invalidation. If you'd written "invalid below 1.2620," you'd have taken a 20-pip loss instead of 50.
One candle is not a trend. A bullish engulfing inside a bearish structure is a pullback, not a reversal. The higher timeframe structure still pointed down.
A 10-minute checklist catches this kind of mistake before you ever place the trade.
Common Daily Bias Mistakes
Finding Your Bias on a 5-Minute Chart
The 5-minute chart shows noise, not direction. Your bias comes from the daily and 4H. Entries come from lower timeframes. Don't confuse the two.
Trading Feelings Instead of a Framework
"I feel like it's going up" is not a bias. A real bias requires evidence: trend structure, price zone, liquidity, a target, and invalidation. If you can't write your bias in one sentence with a specific target and invalidation, you don't have one yet.
Trading Mid-Range Chop
Price at the 50% equilibrium is a coin flip. There's no premium or discount advantage. Sitting on your hands in the middle of the range is a skill, not a weakness. If you struggle with this, you might want to examine some of the common trading mistakes that drain accounts.
Changing Your Bias Every Candle
A bias is set before the session. If your invalidation hasn't been hit, your bias stands. Flipping from long to short because a red candle printed is emotional trading, and it's one of the fastest ways to erode your confidence.
Not Trusting Your Bias
Trust isn't something you summon on demand. It's a byproduct of consistency. Run the checklist every day. Document results. Review weekly. Consistency builds competence. Competence builds confidence. There's no shortcut past that sequence.
How Kill Zones Affect Your Bias
Your daily bias doesn't exist in a vacuum. The forex kill zones (London open, New York open, and the overlap) are when most volume and volatility hit the market. Your bias is most relevant during these windows.
High-probability alignment: Your bias is bullish, price is in discount, and a kill zone is about to open. That's the sweet spot.
Low-probability alignment: Your bias is bullish, but price is in premium during a quiet Asian session. There might not be enough fuel to reach your target. Patience pays here.
Timing your bias execution around session opens gives you better context for when to expect the move and when to sit still.
How EdgeFlo Supports Your Bias Work
EdgeFlo's Edge Plan Builder lets you define and store your daily bias checklist right next to your chart. The pre-market prompts walk you through each step before the session opens so nothing gets skipped.
The Trading Journal auto-imports your trades, so you can review how often your bias was correct versus when you traded against it. Over weeks, that data shows you exactly where your reads are strong and where they consistently break down.
Track Your Bias Accuracy Over Time
Write your bias down. Not in your head. On paper or in a tool where you can review it later. If you write "bullish, targeting 1.0950, invalid below 1.0880" before the session, you can compare that to what actually happened.
Over weeks, you build data. When your reads are consistently wrong in certain conditions (ranging markets, news days, specific pairs), that data tells you where to adjust. A structured journal turns your daily bias from a morning ritual into a feedback loop.
The goal isn't to be right every day. It's to have a process that makes your decision-making visible, repeatable, and improvable.
The Edge Brief
Receive Insights on trading psychology, discipline, and the behavioral patterns that create consistent traders from our Founder and the EdgeFlo team, delivered to your inbox.
Think different. Trade different.
What is daily bias trading?
What is the 90% rule in trading?
What is the 5-3-1 rule in trading?
How do you find daily bias before the market opens?

Turn discipline on.
Every session.
EdgeFlo is the environment serious traders operate inside.
Start 7-Day Trial — $7
Cancel anytime.
No long-term commitment.


Think Different, Trade Different.