

How to Backtest a Trading Strategy (And What to Track)
Learn how to backtest your trading strategy step by step using bar replay, what metrics to record, and when your sample size is large enough to trade live.

Backtesting is how you prove your trading strategy works before you risk a single dollar. You open historical charts, replay price bar by bar, and take trades as if you were there live. Then you record the results. If your win rate, reward-to-risk ratio, and expectancy hold up across 50 or more trades, you have evidence that your edge is real. If not, you know before your account pays the price.
Most beginners skip this step entirely. They find a strategy on YouTube, slap it on a live account, and wonder why they keep losing. The problem is not the strategy. The problem is that they never tested whether it actually works for them, on their timeframe, with their rules.
TL;DR
Backtesting means replaying historical price data and trading your strategy as if it were live, one candle at a time.
Use bar replay on TradingView to eliminate hindsight bias and simulate real decision-making.
Record every trade: entry, exit, stop loss, result, R-multiple, and whether you followed your rules.
You need at least 50 trades (ideally 100) before your results mean anything statistically.
Stop testing and go live when your expectancy is positive and your numbers are stable across different market conditions.
Why Backtesting Comes Before Live Trading
Ever watched a strategy video and thought, "That looks easy, I could do that"? Then you try it with real money and everything falls apart. Your entries feel late. Your stops get hit. You second-guess every setup.
This happens because watching someone else trade is not the same as executing the strategy yourself. Backtesting bridges that gap. It forces you to make decisions with your own eyes, mark your own levels, and pull the trigger on your own setups, all without the financial pressure of a live account.
There is a deeper reason, too. Without test data, you have zero confidence in your strategy. And without confidence, you will hesitate on entries, move your stop loss, or exit early. That hesitation is not a personality flaw. It is the natural result of trading a strategy you have never proven. Conviction in your trades does not come from positive thinking. It comes from a stack of recorded results that show your edge is real.
Think about it like a pilot learning to fly. Nobody hands a student pilot a Boeing 737 and says "good luck." They spend hundreds of hours in a simulator first. Backtesting is your flight simulator. The market conditions are real (historical data), but your money is not at risk.
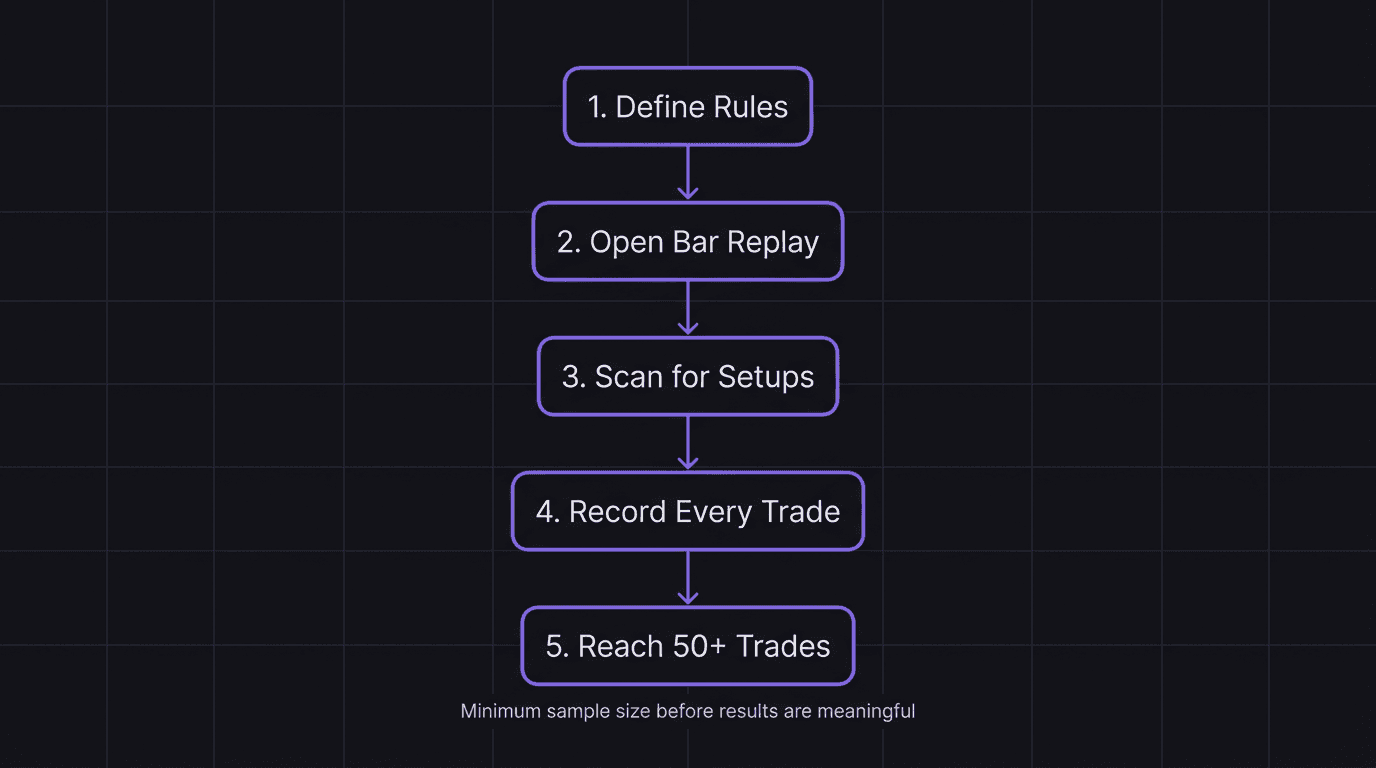
How to Backtest Step by Step
The process is straightforward, but you need to be disciplined about it. Here is the exact workflow.
Step 1: Define Your Rules First
Before you touch a chart, write down your complete strategy rules. Entry criteria, stop loss placement, take profit method, timeframe, and which pairs you trade. If you cannot write it on one page, it is not clear enough to test.
Step 2: Open Bar Replay
Go to TradingView, select your pair and timeframe, and activate bar replay. This hides all future candles and lets you advance the chart one bar at a time. You are now looking at the market exactly as it appeared in real time, with no idea what comes next.
Step 3: Scan for Setups
Advance the chart and look for setups that match your rules. When you spot one, mark your entry, stop loss, and target on the chart. Do not skip ahead. Sit with the candle. Make the decision.
Step 4: Record the Trade
Log every detail in a spreadsheet or journal:
Date and pair
Entry price, stop loss, and target
Direction (long or short)
Result (win or loss)
R-multiple (how many R you gained or lost)
Whether you followed all your rules
That last column matters more than you think. If you "took" a trade that did not meet your rules, mark it. Your backtest is only useful if you are honest about which trades were valid.
Step 5: Repeat Until You Hit 50 Trades Minimum
One trade tells you nothing. Ten trades are a coin flip. You need at least 50 trades, and ideally 100, before your sample size is large enough to trust. Spread your testing across different market conditions: trending days, ranging days, volatile sessions, and quiet sessions.
Walkthrough: Backtesting a Supply and Demand Strategy on EUR/USD
You open bar replay on the EUR/USD 1-hour chart, starting from January 2026. Your rules say: enter long at a demand zone after a bullish break of structure, with your stop loss 5 pips below the zone and your target at 3:1.
On the first day of replay, you spot a demand zone at 1.0850. Price breaks structure to the upside at 1.0870, then pulls back to the zone. You mark your entry at 1.0852, stop loss at 1.0830 (22 pips below), and target at 1.0918 (66 pips above, which is 3:1).
You advance the chart. Price bounces from the zone and reaches your target. That is 1R risked, 3R gained. You log it: EUR/USD, long, win, +3R, rules followed.
Next setup: you see a demand zone at 1.0790, price breaks structure upward at 1.0810, pulls back. Entry at 1.0792, stop at 1.0770 (22 pips), target at 1.0858 (66 pips, 3:1). Price dips to 1.0768 and hits your stop. You log it: EUR/USD, long, loss, -1R, rules followed.
Two trades in. 50% win rate so far, but with only two trades that number is meaningless. Keep going.
What Your Backtest Results Tell You
After 50 or more trades, you have real data to analyze. Here is what to look at.
Win rate is the simplest metric. If you won 20 out of 60 trades, your win rate is 33%. But win rate alone tells you almost nothing. A 33% win rate with a 3:1 average reward is highly profitable. A 60% win rate with a 0.5:1 average reward will slowly drain your account.
Average R-multiple shows how much you gain on winners versus how much you lose on losers. If your average win is 2.8R and your average loss is 1R, your reward-to-risk is strong.
Expectancy is the number that matters most. It tells you how much you expect to make per trade on average. The formula: (win rate times average win) minus (loss rate times average loss). If your expectancy is positive, your strategy makes money over time. If it is negative, no amount of discipline will save it.
Example: 60 trades. 20 wins (33% win rate), 40 losses (67% loss rate). Average win: 3R. Average loss: 1R. Expectancy = (0.33 times 3) minus (0.67 times 1) = 0.99 minus 0.67 = 0.32R per trade.
That 0.32R expectancy means for every trade you take, you expect to make 0.32 times your risk on average. Over 100 trades risking $100 each, that is $3,200 in expected profit. Your trading dashboard should track this number across every testing period so you can see whether your edge is holding or degrading.
Max consecutive losses is another critical number. If your backtest shows a streak of 8 losses in a row, you know that will happen again in live trading. Can your account survive it? Can your psychology handle it?
When to Stop Testing and Start Trading
This is where most traders get stuck. They backtest forever because they are afraid to trade real money. Or they quit too early because they are impatient. Here is a simple framework.
You are ready to move to forward testing when:
You have at least 50 trades logged (100 is better)
Your expectancy is positive
Your results are consistent across different weeks and market conditions, not just one lucky streak
You followed your own rules on at least 80% of trades
You know your worst-case losing streak and can handle it emotionally and financially
You are NOT ready if:
Your sample size is under 30 trades
Your expectancy is negative or barely break-even
Most of your profits came from 2 or 3 outlier trades
You kept bending your rules during the test ("I would have taken that trade differently in real life")
Sound familiar? That last one is the most common trap. If you are adjusting your rules mid-backtest, you are not testing a strategy. You are fitting a strategy to past data, and that strategy will crumble the moment you go live.
Walkthrough: What a "Not Ready" Backtest Looks Like
You test 40 trades over two weeks. Your win rate is 45%, average win is 2.5R, and your expectancy calculates to a positive 0.45R per trade. Looks good, right?
But when you review your log, 12 of those 40 trades did not follow your rules. You entered early on some, moved your stop on others, and skipped the entry criteria on a few "obvious" setups. If you remove the rule-breaking trades, your actual rule-following win rate drops to 32% on 28 trades, and your expectancy goes flat.
That backtest is not ready. You need to go back, tighten your rules, and retest with strict discipline. The data only counts when you follow the plan.
How EdgeFlo Helps You Track Backtest Results
Backtesting generates a lot of data, and tracking it in a messy spreadsheet is how most traders lose the thread. EdgeFlo's trading journal and dashboard let you log every trade with tags for strategy, session, and setup type. The analytics calculate your win rate, average R, and expectancy automatically, so you can see at a glance whether your edge is real.
You can also compare your backtest data against your live results later, which is exactly what forward testing is designed for. When your live numbers match your backtest numbers, you know your strategy translates from replay to real markets.
The EdgeFlo dashboard tracks your equity curve across testing phases, so you can spot whether your edge degrades over time or holds steady. That visual feedback is the difference between guessing and knowing.
How many trades should I backtest before going live?
Can I backtest without bar replay?
What win rate do I need from a backtest?
How long does backtesting take?

Turn discipline on.
Every session.
EdgeFlo is the environment serious traders operate inside.
Start 7-Day Trial — $7
Cancel anytime.
No long-term commitment.


Think Different, Trade Different.