

Supply and Demand Zones: Draw, Validate, Trade
Learn how supply and demand zones work in forex. Three zone types, validation rules, when zones fail, and how to combine them with market structure for better entries.

Supply and demand trading is a method of marking price zones where large unfilled orders sit on a chart. Price leaves a zone with momentum, and the remaining orders pull price back for a reaction when it returns. You are not drawing arbitrary lines. You are marking specific areas where buying or selling pressure created a visible imbalance.
The catch: zones alone do not give you an edge. You need to combine them with market structure to filter which zones are worth trading and which ones will get you stopped out. That filter is what separates consistent traders from the ones who draw 40 zones on a chart and wonder why half of them fail.
TL;DR
Supply and demand zones mark unfilled institutional orders. Price tends to react when it returns to these areas.
Three zone types exist: range, pivot, and fractal. Pivot zones are the tightest and most tradeable for most setups.
Always filter zones through market structure. Trade demand zones in bullish structure, supply zones in bearish. Ignore the rest.
Fresh, unmitigated zones are the priority. Each time price revisits a zone, the remaining order flow shrinks and the probability of a strong reaction drops.
Confirmation before entry is non-negotiable. Wait for a lower-timeframe market shift at the zone before committing capital.
What Supply and Demand Zones Actually Are
A supply zone is a price area where selling pressure overwhelmed buyers, causing price to drop. A demand zone is the opposite: buyers absorbed sellers and pushed price up.
So how is this different from support and resistance? Support and resistance are horizontal levels where price bounced before. Supply and demand zones represent unfilled institutional orders.
Think of it like a store that ran a flash sale but could not fill every order before the doors closed. Those unfilled orders are still in the system. When the store reopens (price returns to the zone), the remaining orders get processed.
When price returns to an unmitigated zone (one that has not been revisited since the breakout), you get a high probability of a reaction. The bigger the imbalance that created the zone, the stronger the expected reaction.
What Makes a Zone Valid
Three things:
Consolidation or a clear pivot point before the breakout
A strong move away from the area (the breakout candle or candles)
Price has not returned yet to fill remaining orders (unmitigated)
If any of those three are missing, skip the zone.
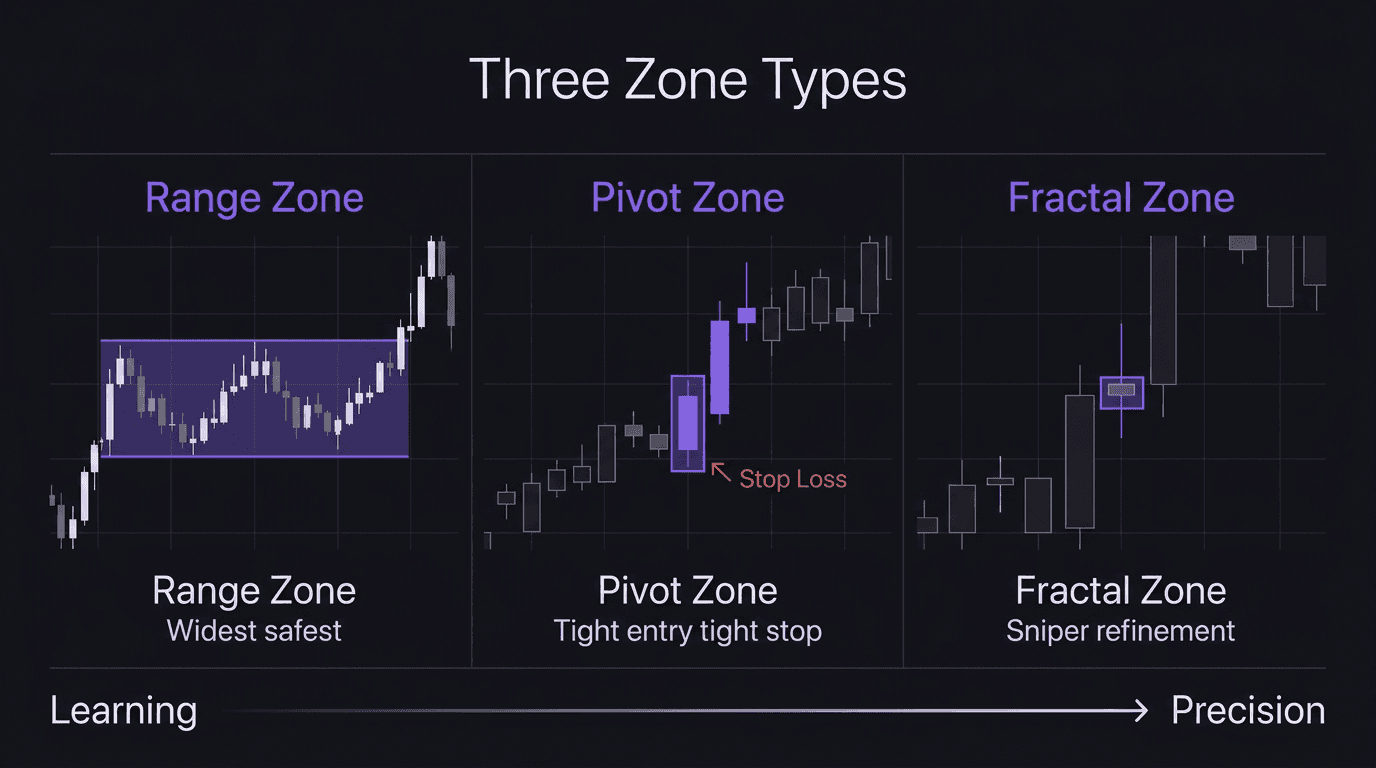
The Three Zone Types
Not all zones are drawn the same way. Here is the practical difference between each one, and when you would actually use them.
Range Zones
The easiest to spot. Price moves sideways between a high and a low, consolidating, then breaks out in one direction.
How to draw it: mark the entire consolidation from highest to lowest point. That full range is your zone.
Range zones are wide. That means wider stop losses. They work best on higher timeframes (daily, weekly) where the wider stop is still proportional to the expected move. If you are just starting with supply and demand, begin here. They are the hardest to miss.
Pivot Zones
Here is where things get tighter and more useful for actual entries. Instead of marking the full consolidation, you mark just the single candle right before the breakout. That one candle. Nothing else.
The validation rule: the breakout candle must close beyond the pivot candle's high (for demand) or low (for supply). A wick poking through does not count. You need a body close. If the first candle after the pivot is an inside bar, skip it and check the next one.
Why do most experienced traders spend their time on pivot zones? Because the entry is tight, the stop is tight, and you are not giving back half your move to a wide zone that covers 50 pips of consolidation. Precision matters.
Fractal Zones
Ever zoom into a 4H candle's wick and find a clean structure hiding inside it on the 15-minute chart? That is a fractal zone. A wick on a higher timeframe that contains a lower-timeframe pivot.
Fractal zones on their own are less reliable. The structure they are based on is smaller. But they are powerful as refinement tools. You have a range zone on the daily chart? A fractal zone within it on the 1H can give you a sniper entry with a tiny stop.
Think of it like GPS. The range zone gets you to the right neighborhood. The fractal zone gets you to the exact address.
Which Type to Use When
Zone Type | Width | Best Timeframe | Reliability | Best For |
|---|---|---|---|---|
Range | Widest | Daily, Weekly | High | Learning, HTF bias |
Pivot | Tight | 1H, 4H, Daily | High | Precision entries |
Fractal | Tightest | 15M, 1H | Lower alone | Refining HTF zones |
The practical workflow: identify the range zone on your higher timeframe to establish the area. Drop to a lower timeframe and look for a pivot zone within that range to tighten your entry and reduce your stop.
How to Validate a Zone
Every chart has dozens of potential zones. Most are not worth trading. Validation is the filter.
The Breakout Must Be Decisive
The move away from the zone needs momentum. For pivot zones, the breakout candle must close beyond the pivot candle's extreme. Large-bodied candles with small wicks moving away from the area signal a strong imbalance. If price drifts away slowly, the zone is weak.
Fresh Zones Beat Retested Zones
The strongest zones are ones price has not returned to since the breakout. When price revisits a zone and reacts, some unfilled orders get filled. The zone has been partially mitigated.
It may still produce a reaction on a second touch, but probability decreases with each visit. Ever watched a zone react beautifully on the first touch, then barely flinch on the third? That is mitigation in action.
Higher Timeframes Carry More Weight
A zone on the daily chart represents larger institutional orders than the same pattern on the 5-minute chart. Pairing zone analysis with high-volume kill zone sessions adds another confirmation layer because institutional activity is concentrated during those windows.
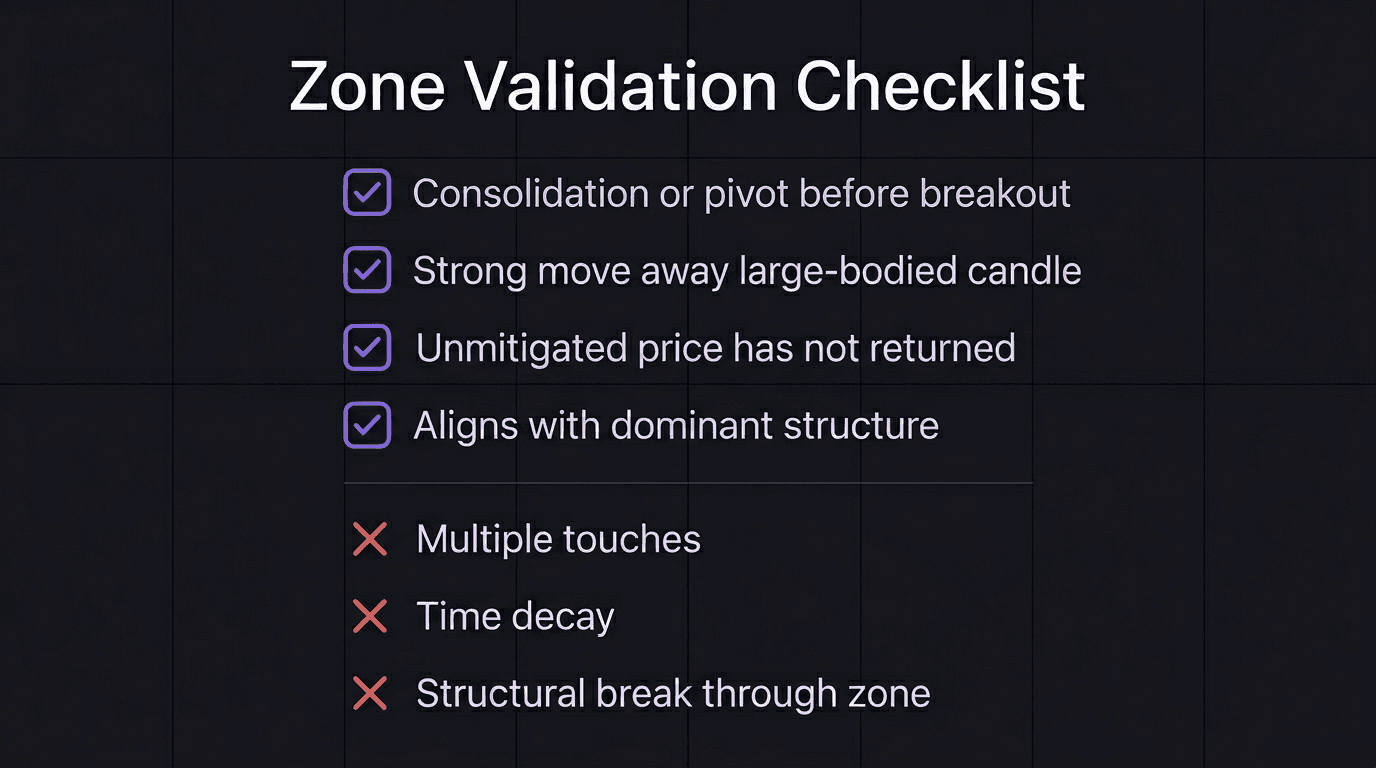
When a Zone Dies
Knowing when to remove a zone from your chart matters just as much as knowing when to draw one.
Full mitigation. Price returns to the zone, trades through it, and continues without reversing. The orders have been filled. Delete the zone.
Multiple touches. Each return trip absorbs some remaining orders. After two or three touches, the remaining flow is significantly reduced. Treat multi-touch zones with skepticism.
Time decay. Zones from weeks or months ago are less reliable than fresh ones. Market conditions shift. The participants who placed those orders may have adjusted their positions.
Structural break. Price breaks through the zone with strong momentum and closes well beyond it. Do not anchor to it hoping for a reversal. It failed. Move on.
Combining Zones with Market Structure
This is where most supply and demand traders either level up or plateau. Zones without structure produce random results: some wins, some losses, no edge.
The question before every trade: who is in control?
In bullish structure (higher highs, higher lows), demand is in control:
Demand zones are expected to hold. Buyers are dominant. When price pulls back to demand, they step in again.
Supply zones are expected to fail. The dominant trend favors buyers breaking through.
Bearish structure flips it. Supply zones hold. Demand zones fail.
This single filter eliminates a huge percentage of losing trades. You only trade zones that align with the dominant structure. Counter-structure trades (shorting a demand zone in a bull trend, for example) have significantly lower win rates.
The Entry Process
Once you have a zone that aligns with structure:
Wait for price to reach the zone. Do not enter early on anticipation.
Watch for a market shift at the zone. A shift in structure on a lower timeframe confirms the zone is producing a reaction. Do not assume a zone will hold.
Enter on the shift, stop beyond the zone. If price breaks through entirely, you are wrong and your stop protects you.
A zone creates a hypothesis. The market shift confirms it. Only then do you act.
Not All Zones Are Equal
Even within the correct structural context, some zones outperform others. The highest-probability zones are the ones that directly caused a break of structure. If a demand zone pushed price through a previous swing high, that zone is significant because it created a structural shift.
When price pulls back after a structural break, look left for unmitigated zones in the area where the breakout started. These represent the order flow that drove the move, and they are the most likely to react on retest.
Example: A Pivot Zone Trade That Worked
GBP/USD, 4H and 15M, January 2026
GBP/USD had been in bullish structure on the 4H, printing higher highs and higher lows. On January 14, price consolidated around 1.2680 for several hours and then broke out with a strong bullish candle that closed at 1.2735, well above the consolidation high.
That consolidation candle at 1.2680 became the pivot zone. The breakout candle closed beyond it cleanly, validating the zone.
Over the next two days, price continued higher to 1.2810, then began to pull back. On January 17, price returned to the 1.2680 zone during London session (a high-volume kill zone).
The trader dropped to the 15-minute chart and waited. At 1.2685, a lower-timeframe shift occurred: a series of lower lows on the 15M reversed into a higher high. That was the confirmation.
Entry: 1.2690, with a stop below the zone at 1.2655. Target: the previous swing high at 1.2810. Price reached 1.2795 within 48 hours. Risk-to-reward: roughly 3:1.
The zone was fresh (first touch), aligned with bullish structure, and the entry came after a confirmed lower-timeframe shift. That is the full checklist in action.
Example: A Zone Trade That Failed
EUR/USD, 1H, February 2026
EUR/USD was in bearish structure on the daily chart. Lower highs, lower lows, clear downtrend. But on the 1H chart, a demand zone had formed around 1.0420 after a brief consolidation and upward push.
The trader saw the zone, saw that it was unmitigated, and placed a buy limit order at 1.0425 with a stop at 1.0400. No confirmation. No check on the dominant structure.
Price hit 1.0425 during New York session on February 5. The order filled. Price wicked down to 1.0418, paused for about 20 minutes, then dropped hard to 1.0380. The stop at 1.0400 was hit. Full loss.
What went wrong:
The zone was counter-structural. A demand zone in bearish daily structure is a low-probability trade. Supply is in control. Demand zones in downtrends get run through.
No confirmation. The trader set a limit order instead of waiting for a lower-timeframe market shift. Price entered the zone and kept going.
The zone was a fractal, not a pivot. On closer inspection, the "zone" was based on a 15-minute wick inside a 1H candle. Fractal zones in isolation, without alignment from a higher-timeframe range or pivot, are unreliable.
This is the most common trading mistake with supply and demand: ignoring the structural context. A clean zone on the chart is not enough. You need the structure to support it.
Common Mistakes with Supply and Demand
Trading Zones Without Structure
The number one error. A clean demand zone in a bearish trend is a trap. Always filter zones through the dominant structure. Understanding your daily bias helps you align zones with the broader directional picture before you even start marking levels.
Treating Every Zone Equally
A fresh, unmitigated pivot zone on the daily is not the same as a three-times-touched fractal zone on the 5-minute. Weight your zones by timeframe, freshness, and breakout quality.
Entering Without Confirmation
Drawing a zone and setting a limit order at its edge removes the confirmation step. Price may wick into the zone and then blow through it. Waiting for a lower-timeframe market shift adds a filter that dramatically improves outcomes.
Ignoring Mitigation
Once a zone has been touched, the remaining order flow is reduced. Trading the same zone on its third or fourth visit as if it is still fresh is a losing habit.
Confusing Liquidity Sweeps with Zone Breaks
Sometimes price wicks through a zone to sweep liquidity and then reverses hard. That is different from a clean break. Knowing where liquidity sits (at obvious highs and lows) helps you tell the difference between a failed zone and a grab.
Not Tracking Zone Performance
If you do not record which zone types, timeframes, and structural contexts produce your best results, you are guessing. Document every zone trade: type, timeframe, mitigated or fresh, structural alignment, and result.
After 50 trades (or sooner if you backtest on historical data), the numbers will show exactly where your edge lives. Reviewing entries relative to premium and discount zones adds another layer of clarity.
How EdgeFlo Supports Zone-Based Trading
EdgeFlo's Edge Plan Builder lets you document your zone-drawing criteria, validation rules, and structural filters. Those rules stay visible next to your chart during every session instead of living in a notebook you forget to open.
The Journal tags each trade by setup type. After 30 days, you can pull up your actual win rate by zone type, timeframe, and structural alignment. No more guessing which setups work for you and which do not.
Guardrails warn you when you are entering against the dominant structure. You can override (it is always your call), but you have to make that choice deliberately.
The Edge Brief
Receive Insights on trading psychology, discipline, and the behavioral patterns that create consistent traders from our Founder and the EdgeFlo team, delivered to your inbox.
Think different. Trade different.
Is supply and demand a good trading strategy?
What are the main types of supply and demand zones?
What timeframe works best for supply and demand?
When does a supply or demand zone become invalid?

Turn discipline on.
Every session.
EdgeFlo is the environment serious traders operate inside.
Start 7-Day Trial — $7
Cancel anytime.
No long-term commitment.


Think Different, Trade Different.