

Supply-to-Demand Flip Zones: The Entry Signal Most Traders Miss
Learn what a supply-to-demand flip zone is and how to identify one on a chart. Use flip zones to find high-probability entries where order flow shifts.

A supply zone is supposed to push price down. That is its job. When price reaches a supply zone, sellers should step in and continue the downtrend. But sometimes the zone fails. Price comes in, pokes around, and instead of dropping, it forms a higher low. Right there, supply just became demand. That failed reaction is the single most powerful entry signal in order flow trading.
This is a supply-to-demand flip zone. It tells you that the sellers who controlled the zone have been absorbed. Buyers took over. And the level that used to reject price downward now acts as a floor.
TL;DR
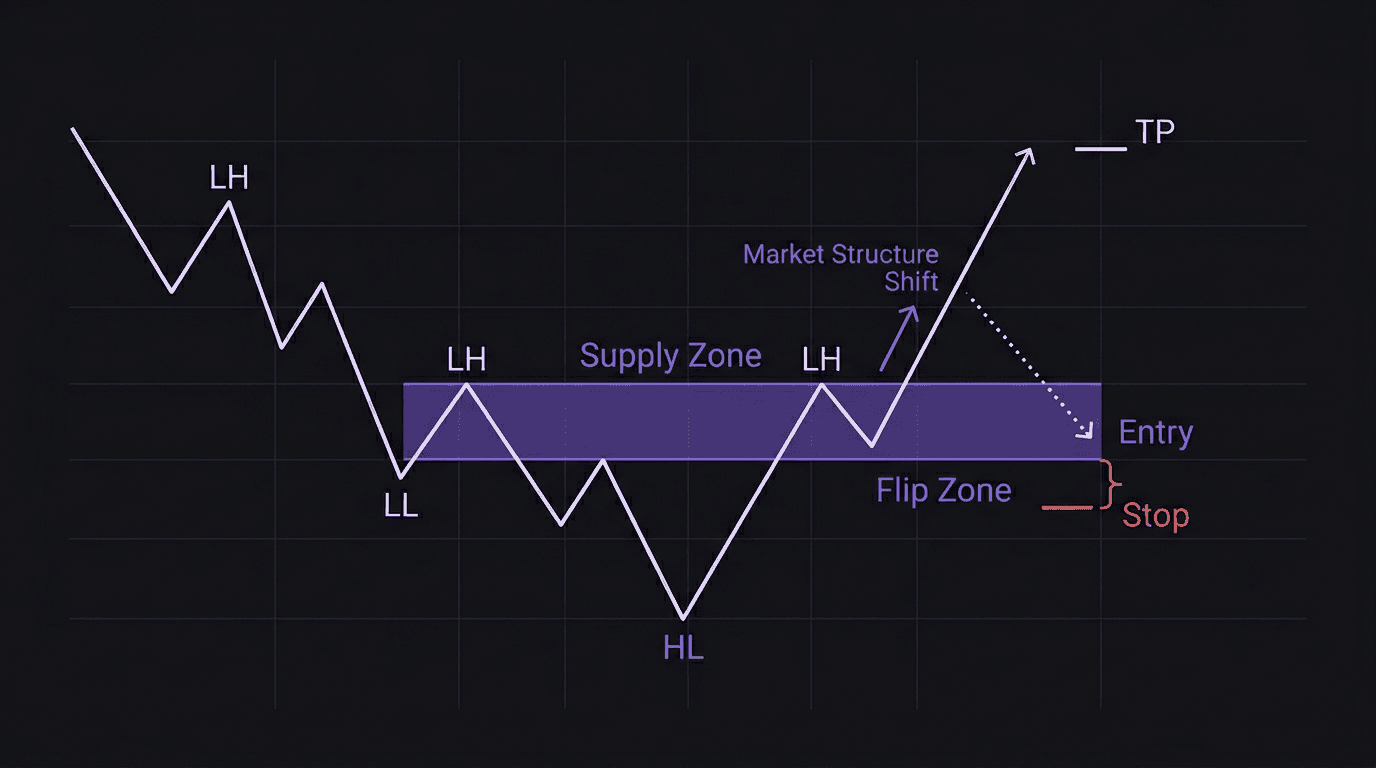
A flip zone forms when a supply zone fails to push price lower and creates a higher low instead.
The failed reaction confirms that order flow has shifted from bearish to bullish (or vice versa for demand-to-supply flips).
Enter when price retests the flip zone from above, after a market structure shift confirms the new direction.
Stop-loss goes below the flip zone structure, protecting you if the flip was fake.
Flip zones work on every timeframe because the underlying mechanics are the same.
What Is a Supply-to-Demand Flip Zone
Picture a downtrend. Price makes lower highs and lower lows, printing clean bearish market structure. At each lower high, a supply zone forms. These are the zones where sellers entered and pushed price to new lows.
Now price drops to a deeper level and reacts. Buyers step in. Price rallies back up toward the last supply zone. If that zone does its job, price should reject and continue lower. But instead, something different happens. Price enters the supply zone, pauses, and forms a higher low. It does not break to a new low. The supply is exhausted.
That higher low is the confirmation. The zone that was supply is now demand. The sellers who were defending that level are gone. Buyers absorbed their orders. When price returns to this zone in the future, you expect buying pressure, not selling.
The flip zone itself is the price range between the original supply zone and the higher low that formed inside or below it. This is where you want to be a buyer on the retest.
How to Identify the Flip on a Chart
Spotting a flip zone requires watching for a specific sequence:
Identify the active supply zone. Find the zone where the last lower high formed. This is an unmitigated supply zone, and price has not traded back through it yet.
Watch for the failed reaction. When price returns to this supply zone, does it create a new lower low? If yes, the supply zone held and the downtrend continues. If no, if price instead prints a higher low, the zone has failed.
Mark the flip. The zone where the failed reaction happened is now your flip zone. Draw it from the base of the original supply zone to the higher low.
Wait for the market structure shift. After the higher low, price should break above the last lower high. That break of structure confirms that order flow has shifted.
Trade the retest. When price pulls back to your flip zone after the shift, look for entries.
The critical step is number 2. The failed reaction is what separates a flip zone from a regular supply zone. Without the higher low, you just have a zone that held.
Walkthrough: GBP/USD Flip Zone Entry
GBP/USD has been dropping for two days on the 4-hour chart. Price prints lower highs at 1.2680, 1.2640, and 1.2610. The supply zone at 1.2610 to 1.2625 formed where the last lower high occurred.
Price drops to 1.2560 and reacts. Buyers push price back up to the 1.2610 supply zone. Instead of rejecting, price enters the zone and holds. It pulls back to 1.2575, which is a higher low compared to the 1.2560 swing low. The supply zone has failed.
The flip zone sits between 1.2575 and 1.2610. Order flow is shifting.
Price then pushes above 1.2625 (the previous lower high), confirming the market structure shift. On the 15-minute chart, you see the same pattern in miniature. Price pulls back into the flip zone, reaching 1.2590. You enter long at 1.2590 with a stop at 1.2555 (below the 1.2560 swing low plus buffer) and a target at 1.2700 (the next unmitigated supply zone from two days earlier).
With a 35-pip stop and 110-pip target, that is a 3.14:1 risk-to-reward ratio. Trading 0.3 lots ($3 per pip), the risk is $105 and the potential reward is $330.
Why Flip Zones Produce High-Probability Entries
Flip zones work because of what happened at the zone mechanically. The sellers who built the original supply zone have been absorbed. Their limit orders were filled by aggressive buyers. When price returns to the zone, those sellers are gone. There is no more supply at that level.
At the same time, institutions who bought at the flip zone now have positions to protect. When price returns to their entry area, they are likely to add to their position or defend the zone. This creates a natural floor.
Compare this to trading a random support level. A horizontal line at a previous swing low might hold, but you have no evidence that the dynamics at that level have changed. A flip zone gives you that evidence. You know sellers tried and failed. You know buyers stepped in and absorbed. The price action at the zone has already told you who controls it.
That is why waiting for the flip matters more than jumping in at every zone. Most supply and demand zones hold on the first touch. The flip zone is special because it marks the transition, the point where control shifts from one side to the other.
Common Mistakes When Trading Flip Zones
Entering before the market structure shift. A higher low inside a supply zone is promising, but it is not confirmation. Price can still create a deeper low. Wait for the break above the last lower high before treating the flip as valid. Without the shift, you are guessing.
Drawing the flip zone too wide. The flip zone should be tight. It spans from the base of the original supply zone to the higher low. If you stretch it to include the entire move, your entry zone becomes so large that your stop distance makes the risk-to-reward terrible.
Ignoring the higher timeframe. A flip zone on the 5-minute chart means nothing if the 4-hour chart is printing a clean downtrend with no sign of reversal. Flip zones need higher-timeframe context. The best flip zone entries happen when the flip aligns with a higher-timeframe demand zone or a change in order flow.
Trading every flip zone the same way. Not all flips are equal. A flip that includes a liquidity sweep below the lows before the higher low forms is stronger than one without. The sweep clears out stop orders and gives institutions better fill prices. A sweep plus flip zone carries more conviction than a plain flip.
Walkthrough: Premature Flip Zone Entry
A trader sees AUD/USD form what looks like a higher low at 0.6520 inside a supply zone at 0.6530 to 0.6545 on the 1-hour chart. The previous swing low was 0.6510. Excited about the potential flip, they enter long at 0.6525 without waiting for a market structure shift.
Price pushes up to 0.6540 but fails to break above the last lower high at 0.6555. Instead, it rolls over and drops to 0.6500, stopping the trader out for a 25-pip loss.
The mistake: the higher low was real, but the market structure shift never happened. Price never broke above 0.6555, so the flip was never confirmed. The zone still belonged to the sellers. Patience costs nothing. Entering early costs money. Always wait for the break above the last lower high before committing.
Use backtesting to see how often your flip zone entries work with and without the market structure shift confirmation. The difference in win rate is usually significant enough to settle the argument.
How EdgeFlo Tracks Your Flip Zone Win Rate
Flip zones are a specific setup type. Over 50 or 100 trades, you need to know whether they actually produce positive expectancy in your hands, not just in theory.
EdgeFlo's trading journal lets you tag trades by setup type. You can tag entries as "flip zone," "sweep plus flip," or whatever naming convention matches your process. Over time, you see your win rate, average R, and expectancy broken down by setup.
If your flip zone trades win at 55% with an average 3R reward but your other entries win at 40% with 1.5R, the data tells you exactly where to focus. That kind of clarity only comes from consistent tracking.
What is a flip zone in trading?
How do you confirm a supply-to-demand flip?
Can flip zones work in both directions?
Where do you enter after a flip zone forms?

Turn discipline on.
Every session.
EdgeFlo is the environment serious traders operate inside.
Start 7-Day Trial — $7
Cancel anytime.
No long-term commitment.


Think Different, Trade Different.