

5 Places Liquidity Hides on Every Forex Chart
Liquidity pools form at 5 predictable locations on every forex chart. Learn to mark them before each session so you stop being the fuel for institutional moves.

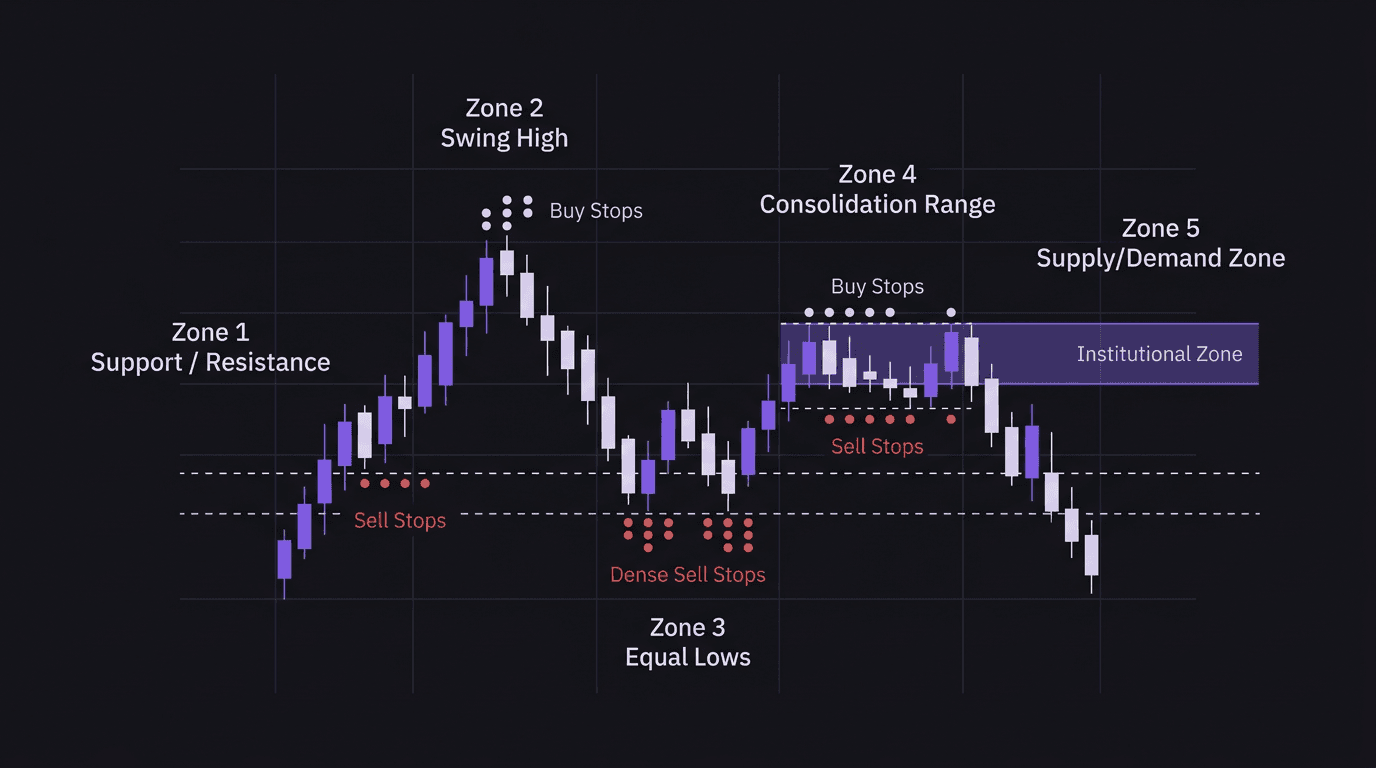
Liquidity pools form at five predictable locations on every forex chart: above and below support/resistance levels, around swing highs and swing lows, near equal highs and equal lows, on both sides of consolidation ranges, and at institutional supply and demand zones. Marking these five spots before each session gives you a map of where price is likely to sweep before the real move begins.
TL;DR
Support and resistance levels are not bounce zones. They are order magnets where stops and pending entries cluster.
Swing highs collect buy stops above them. Swing lows collect sell stops below them.
Equal highs and equal lows are the strongest liquidity magnets because they concentrate orders at a single visible price.
Consolidation ranges build liquidity on both edges as breakout traders and range traders stack opposing orders.
Institutional supply and demand zones combine liquidity with the zones that caused structural breaks, creating the highest-probability entry locations.
Liquidity at Support and Resistance
Support and resistance are where beginners learn to trade. "Buy at support, sell at resistance." The problem is that every trader following that playbook places their stops in the same spot, and those stops become a target.
Below a support level, you will find two types of orders. First, stop losses from traders who entered long at that support. They place their stops just below the level, creating a cluster of sell-side orders. Second, sell stop entries from breakout traders who want to get short if price breaks below support. Both types sit in the same zone, stacking into a dense liquidity pool.
The same logic applies above resistance. Buy stops from short sellers protecting their positions and buy stop entries from breakout traders form a pool of buy-side liquidity.
When institutions need to buy, they sweep below support first. When they need to sell, they sweep above resistance. The "failed breakout" you see on charts is usually just this process playing out: price takes the liquidity, then reverses.
Walkthrough: The Resistance Sweep on EUR/USD
EUR/USD tests resistance at 1.0960 three times on the 1-hour chart. Each rejection builds confidence that resistance will hold. Short sellers enter near 1.0960, placing buy stops at 1.0975 and 1.0980. Breakout buyers also stack buy stop entries at 1.0965 and above. At 8:15 AM EST during the London/New York overlap, price spikes to 1.0982, triggering every buy stop above resistance. Institutions use those buy orders to fill their short positions. Price reverses from 1.0982 and drops to 1.0890.
The traders who shorted at resistance with tight stops above it got swept. The traders who waited for the sweep, then shorted after confirmation, caught the 92-pip drop.
Liquidity Above Swing Highs and Below Swing Lows
Every swing high and swing low on your chart is a liquidity magnet. Above each swing high, buy stops accumulate. Below each swing low, sell stops accumulate.
When you mark a swing high on the 4-hour chart, you are also marking where traders who shorted near that high placed their protective stops. You are marking where momentum traders placed buy stop entries hoping to catch a continuation. Those orders do not disappear. They sit and wait.
Institutions know exactly where these clusters are. When they need liquidity to facilitate a pullback (creating a lower high in a downtrend, for example), they drive price up into the swing high liquidity to grab the fuel, then reverse.
This is why understanding market structure matters so much for reading liquidity. If the trend is bearish and making lower highs and lower lows, each internal swing high is a potential sweep target. Price sweeps the high, grabs the orders, and creates the next lower high before continuing down.
Equal Highs and Equal Lows as Liquidity Magnets
If swing highs attract liquidity, equal highs are magnets on steroids. When price creates two or three highs at roughly the same level, every trader on the chart sees it. That visibility concentrates orders at one price with extreme density.
Below equal lows, sell stops stack from multiple touches. Each time price bounced off that level, more traders entered long and placed their stops just underneath. Each bounce also attracted more breakout sellers who placed sell stops at or below the level.
The result is a single price zone holding an outsized number of resting orders. Institutions only need to sweep one level to fill a massive position. Equal highs and equal lows are efficient targets because the fuel is concentrated rather than spread across multiple levels.
When you see equal highs or equal lows forming on your chart, mark them immediately. They are telling you exactly where the next sweep is likely to happen.
Walkthrough: Equal Lows Swept at London Open
GBP/USD creates three equal lows at 1.2710 during the Asian session. Multiple long entries accumulate, all with stops clustered below 1.2700. At 3:05 AM EST, London opens. Price drops to 1.2694, sweeping below 1.2700 and triggering the sell stops. A sharp V-shaped reaction follows. Price closes back above 1.2710 by 3:20 AM and rallies to 1.2790.
Three equal lows screamed "sweep me." London obliged. The traders who placed stops below 1.2700 lost. The traders who anticipated the sweep and waited for the V-shaped reaction entered 3R trades.
Consolidation Ranges Build Liquidity on Both Sides
Consolidation is where liquidity accumulates the most evenly. When price chops sideways for an extended period, orders stack on both edges of the range. Above the range, buy stops and buy limit entries accumulate. Below the range, sell stops and sell limit entries accumulate.
This is why breakouts from consolidation often start with a fake move. Price breaks below the range, sweeps the sell-side liquidity, then reverses and breaks above. Or price breaks above first, sweeps the buy-side, then drops through. The initial "breakout" is the sweep. The real move comes after.
During the Asian session, consolidation is especially common. Price builds a tight range for hours while London and New York traders are offline. When the active session opens, all that accumulated liquidity becomes available fuel.
Your pre-session chart markup should always include the edges of any consolidation range visible on your 15-minute or 1-hour chart. Mark both edges. One of them will be swept early in the active session, and that sweep tells you which direction the real expansion is heading.
How EdgeFlo Marks Your Key Levels
Spotting liquidity is the analysis. The execution challenge is doing your pre-session markup consistently and then waiting for the sweep rather than front-running it. EdgeFlo's Edge plan builder lets you document your key levels for each session, including which swing highs, equal lows, or consolidation edges you are watching. Before the session opens, you write down where liquidity sits and what you need to see before entering.
After the trade, the journal captures whether the actual sweep matched your pre-session markup. Over time, you build data on which of the five liquidity locations produces your best entries and which ones you misread most often. That feedback loop turns liquidity reading from a theory into a skill you can measure.
The markup takes 10 minutes. The discipline to wait for the sweep takes longer to build. But when you see your data showing that liquidity sweep entries at equal lows return 3R while your impulse entries at random support levels lose money, the choice becomes obvious.
Where does liquidity hide on a forex chart?
Why do equal lows attract liquidity sweeps?
Should I mark liquidity levels before each session?
How do consolidation ranges build liquidity?

Turn discipline on.
Every session.
EdgeFlo is the environment serious traders operate inside.
Start 7-Day Trial — $7
Cancel anytime.
No long-term commitment.


Think Different, Trade Different.