

Pre-Session Chart Markup: Mark Levels Before the Move
Mark your key levels before the session opens so you react to price instead of chasing it. A pre-session markup process that takes under 15 minutes.

The session opens. Price starts moving fast. You scramble to find levels, draw zones, figure out the trend. By the time you have a plan, the move already happened. Sound familiar?
Most traders lose at the open not because they lack skill, but because they start thinking when they should already be reacting. The fix is finishing your analysis before the candle that matters ever prints.
TL;DR
Complete all chart markup before your trading session opens so you react to price instead of analyzing under pressure.
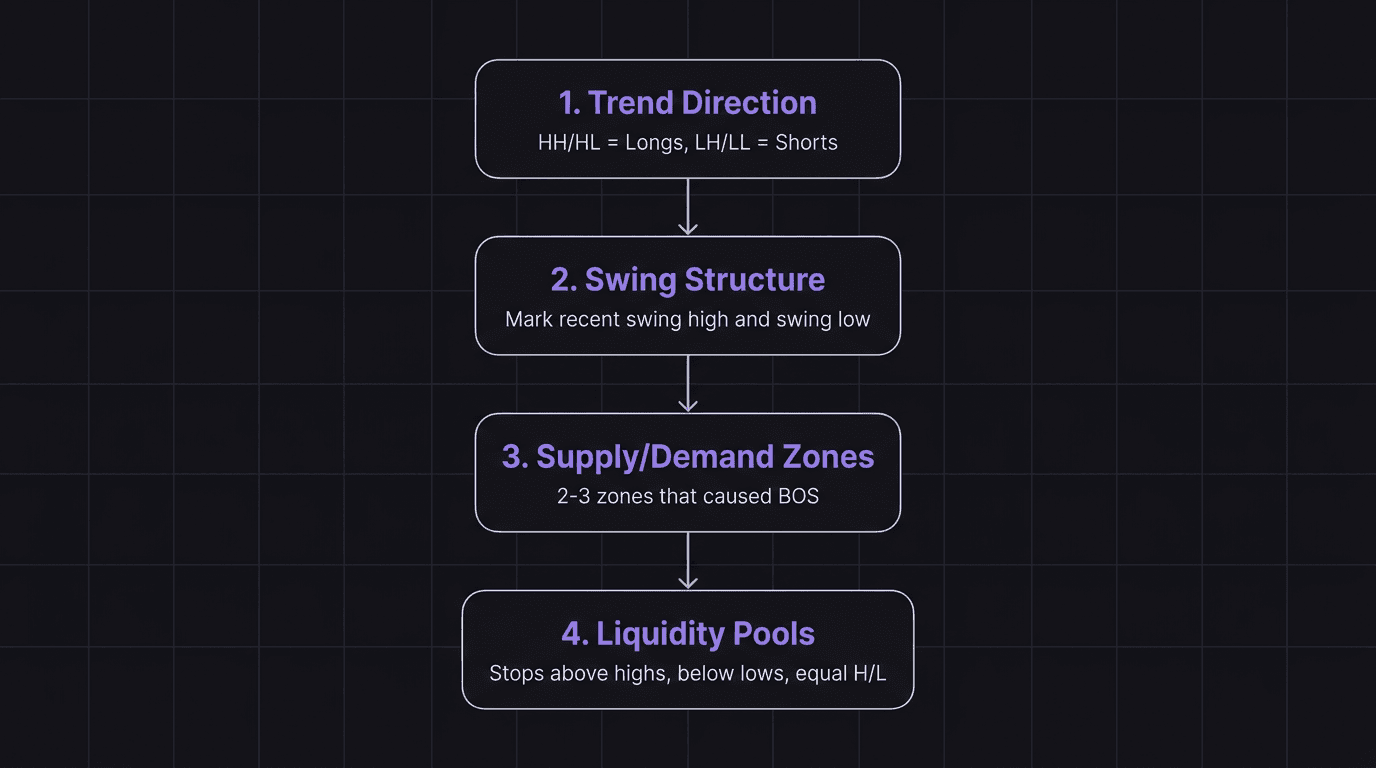
A structured markup covers four things: trend direction, swing structure, supply and demand zones, and visible liquidity pools.
Limit your watchlist to 3 or 4 pairs. More pairs means rushed markups and missed details.
If price does not reach any of your marked levels during the session, you do nothing. That is the discipline the markup enforces.
Pair your markup with a pre-market routine so the process becomes automatic.
Why Markup Before the Session Changes Everything
When the London session opens at 3:00 AM EST or the New York session opens at 8:00 AM EST, price moves fast. Institutional volume floods in, and the chart goes from quiet consolidation to rapid expansion in minutes.
If you are still drawing zones when that happens, you are making decisions under stress. And stressed decisions are bad decisions. You draw sloppy zones, misjudge the trend, or enter trades at levels you would have rejected with a clear head.
Pre-session markup solves this by separating analysis from execution. The analysis happens in the calm before the storm. The execution happens when the storm arrives. You already know where you want to buy, where you want to sell, and where you will do nothing at all.
Think of it like this: a surgeon does not study the procedure while the patient is on the table. The study happens before. The operating room is for executing what was already planned.
The Four Things to Mark
Your chart does not need 47 lines, 12 indicators, and a prayer. It needs four things marked cleanly.
1. Trend Direction
Open the higher timeframe (4-hour or daily) and answer one question: is price making higher highs and higher lows, or lower highs and lower lows?
If the answer is higher highs and higher lows, you are looking for longs. Lower highs and lower lows, you are looking for shorts. If you cannot tell, the pair is ranging, and it goes to the bottom of your watchlist.
Write it down or mark it on your chart. "EUR/USD: Bearish. Lower highs, lower lows." That single line prevents half of the bad trades most people take, because it stops you from buying in a downtrend or selling in an uptrend.
This is the first step in building a daily bias that holds up under pressure.
2. Swing Structure
On your execution timeframe (15-minute or 5-minute), identify the most recent swing high and swing low. These define the range you are trading within.
Mark the swing high with a horizontal line. Mark the swing low with another. Everything you do during the session happens between these two levels or at their edges.
If price is bearish, you are expecting the swing low to get taken out eventually. The swing high is where price needs to stay below to maintain the trend. If price breaks above that swing high, the structure shifts, and your bias may change.
3. Supply and Demand Zones
Identify the zones that caused the most recent break of structure. These are the areas where institutional orders previously entered the market and pushed price in a direction.
For a bearish trend, you want to mark the supply zones (the areas that created the move down). Those are your potential short entry areas. For a bullish trend, mark the demand zones.
Keep it to 2 or 3 zones maximum. More than that creates decision paralysis. You want clear, obvious zones that sit near the swing high or swing low, not every tiny reaction on the chart.
4. Liquidity Pools
Where are the resting orders? Look for:
Stops sitting above the most recent swing high (buy stops)
Stops sitting below the most recent swing low (sell stops)
Equal highs or equal lows that create obvious pools
Consolidation ranges from the Asian session with stops on both sides
Mark these with a different color or a dotted line. These are not entry zones. These are the levels where price is likely to reach for fuel before making the real move.
When the session opens, you will be watching to see which liquidity gets swept first. That sweep often reveals the direction of the actual move.
The 15-Minute Markup Walkthrough
Here is exactly how to do this, step by step, on a real pair.
Walkthrough: EUR/USD Before the London Open
Time: 2:45 AM EST. London opens in 15 minutes.
Step 1 (2 minutes): Trend direction. Open the 4-hour chart. Price has been making lower highs and lower lows for the past three days. The most recent break of structure was to the downside, confirming bearish momentum. Bias: short.
Step 2 (3 minutes): Swing structure. Switch to the 15-minute chart. The most recent swing high is at 1.0940. The most recent swing low is at 1.0870. Mark both with horizontal lines. Price is currently at 1.0905, in the middle of the range. For the bearish trend to continue, price needs to stay below 1.0940 and take out 1.0870.
Step 3 (5 minutes): Supply and demand zones. The move from 1.0940 down to 1.0870 was caused by a supply zone between 1.0935 and 1.0945. Mark it. There is a smaller supply zone at 1.0920 to 1.0925 where a minor lower high formed. Mark it. That is two zones. Enough.
Step 4 (3 minutes): Liquidity pools. During the Asian session, price consolidated between 1.0900 and 1.0915. There are buy stops above 1.0915 and sell stops below 1.0900. There are also buy stops above the swing high at 1.0940 and sell stops below the swing low at 1.0870.
Total time: 13 minutes. The chart is marked. Now you wait.
When London opens, you watch. Does price push above 1.0915 to grab Asian session buy stops before dropping? Does it push below 1.0900 first? Which supply zone does it reach? You are not thinking. You are reacting to levels you already identified.
What If Price Hits Nothing?
Sometimes London opens and price drifts sideways. None of your zones get tested. No liquidity gets swept. The session is quiet.
In that case, you do nothing. Close the chart. Walk away. Come back for the New York kill zone if you trade that session, or wait until tomorrow.
The markup process forces discipline because it defines exactly what you need to see before taking action. No markup level hit means no trade. That is the whole point.
The Worst Pre-Session Mistake
The single biggest markup mistake is doing the markup and then ignoring it.
Price approaches your zone. Your analysis says short. But the candle looks bullish, so you hesitate. Or price sweeps liquidity, and instead of entering, you think "what if it goes higher?" You start re-analyzing in real time, second-guessing the work you did 20 minutes ago.
This is where trading rules save you. The markup is the plan. The session is the execution. If you keep redrawing zones during the session, you are not executing a plan. You are improvising. And improvising in fast markets costs money.
One rule that helps: do not add or move any lines after the session opens. What you marked before the open is what you trade. If the chart does not look the same after the open as it did before, it means the conditions changed, and the correct action is often no trade at all.
Building Markup Into a Routine
The markup process works best when it is the same every time. Same steps, same order, same checklist.
Here is a simple checklist format:
Pair: ___
Higher TF trend: Bullish / Bearish / Ranging
Swing high: ___
Swing low: ___
Supply zones (max 3): ___
Demand zones (max 3): ___
Liquidity above: ___
Liquidity below: ___
Session: London / New York
Bias: Long / Short / No trade
Fill this out before every session. It takes less time than you think, and it creates a written record you can review later.
Pair this with a broader pre-market routine that includes news checks, risk settings, and mindset preparation. The chart markup is the technical piece; the routine is the full preparation system.
Limiting Your Watchlist
You cannot properly mark up 15 pairs in 15 minutes. Attempting it means rushing, missing key levels, and making sloppy zone selections.
Three to four pairs is the sweet spot for most traders. Pick pairs that:
Have clear trend structure on the higher timeframe
Are liquid enough for your session (major pairs for London and New York)
You have historical familiarity with (you know how EUR/USD moves differently from GBP/JPY)
If a pair does not have a clear trend direction during step one, skip it entirely. A ranging pair is not worth marking up because the signals it produces during the session will be ambiguous.
Trading consistency comes from doing the same thing every day, not from covering every pair on the board.
How EdgeFlo Supports Your Pre-Session Process
EdgeFlo's pre-market prompts surface your checklist before you open a single chart. These prompts guide you through your preparation steps so nothing gets skipped when you are tired or distracted.
The trading window guardrail adds another layer. Set your active window to London (3:00 AM to 6:00 AM EST) or New York (8:00 AM to 11:00 AM EST), and EdgeFlo restricts execution outside that window. You can override if conditions demand it, but the default prevents you from jumping into a trade before your markup is complete.
That combination of pre-session prompts and session-locked execution turns the markup process from a good idea you sometimes follow into a structural part of your trading day. You finish the markup, the window opens, and you execute on the levels you already identified. No scrambling. No improvising. Just reaction.
The Edge Brief
Receive Insights on trading psychology, discipline, and the behavioral patterns that create consistent traders from our Founder and the EdgeFlo team, delivered to your inbox.
Think different. Trade different.
What should I mark on my chart before the session opens?
How long does a pre-session chart markup take?
Should I mark up charts before the London or New York session?
What happens if price does not reach any of my marked levels?

Turn discipline on.
Every session.
EdgeFlo is the environment serious traders operate inside.
Start 7-Day Trial — $7
Cancel anytime.
No long-term commitment.


Think Different, Trade Different.