

Higher Highs and Higher Lows: Mapping Rules
Learn the mechanical rules for mapping higher highs and higher lows on any chart. Know exactly when the pattern breaks and what it signals.

Higher highs and higher lows is the mechanical definition of a bullish trend. Each swing high is above the previous swing high. Each swing low is above the previous swing low. If both conditions are true, the trend is up. If either condition fails, the trend is either pausing or reversing. There is no interpretation needed. You either have the pattern or you do not.
This sounds basic, and it is. But the number of traders who get this wrong, who mark the wrong swing points, skip levels, or see patterns that are not there, is surprisingly high. The fix is a set of mechanical rules that remove all guesswork.
TL;DR
Higher highs and higher lows = bullish trend. Each swing point must be higher than its predecessor. Both conditions required.
Mark only significant swing points, not every minor wick or candle spike.
A swing high is confirmed when price makes a lower low after it. A swing low is confirmed when price makes a higher high after it.
The pattern breaks when price closes its body below a previous swing low. That is a market structure shift.
Map the pattern on your higher timeframe first, then use it to set your daily bias.
What Higher Highs and Higher Lows Actually Mean
Every chart tells a story about who is winning: buyers or sellers. Higher highs and higher lows is the simplest way to read that story.
A higher high means buyers pushed price to a new peak that exceeds the last peak. Demand is strong enough to keep making new territory.
A higher low means that when sellers tried to push price back down, they could not push it as far as last time. The floor keeps rising. Buyers are stepping in at higher prices each time.
Put those together and you have a trend. Buyers are in control. They are making new highs and defending higher levels on each pullback.
The bearish version is the mirror image. Lower highs and lower lows mean sellers are in control. Each rally fails lower than the last. Each drop reaches new depths. Sellers are winning.
This is not subjective analysis. It is a factual observation about price behavior. Either the pattern exists on your chart or it does not. Your opinion about where the market "should" go is irrelevant.
Here is the critical point most beginners miss: both conditions must be true simultaneously. A higher high alone does not confirm the trend. You need the corresponding higher low. And a higher low alone does not confirm it either. You need the subsequent higher high. The sequence must be intact.
How to Map Them Mechanically
This is where most traders go wrong. They look at a chart, vaguely point at some peaks and troughs, and decide the trend is up. That is not mapping. That is guessing.
Here are the rules.
Rule 1: Identify Significant Swing Points Only
Not every candle high is a swing high. Not every candle low is a swing low. A significant swing high is a price point where the market reversed and moved lower. A significant swing low is a price point where the market reversed and moved higher.
On a 4-hour chart, a swing point typically involves multiple candles. A single candle that pokes higher and immediately reverses might be a liquidity sweep, not a genuine swing high.
Practical filter: A swing high needs at least a few candles of price decline after it before you mark it. A swing low needs at least a few candles of price increase after it. The exact number depends on your timeframe, but the principle is consistent: swing points are confirmed by the move that follows them, not by the peak or trough itself.
Rule 2: Confirm Each Point Sequentially
Mark your chart from left to right. Start with the oldest visible swing low. Then find the next swing high. Then the next swing low. Then the next swing high. And so on.
At each step, ask:
Is this swing high above the previous swing high? If yes, higher high confirmed.
Is this swing low above the previous swing low? If yes, higher low confirmed.
If you get a "no" at any point, the sequence is broken. Stop mapping and reassess.
Rule 3: Use Body Close for Confirmation
A swing high is only "broken" (which would mean a new higher high) when a candle's body closes above it. Wicks do not count at the swing level. This prevents you from marking false highs created by liquidity grabs.
Same for swing lows. A new higher low is only confirmed when subsequent price action makes a higher high after it. Until that higher high prints, you do not know if the low you are looking at will hold.
Walkthrough: Mapping EUR/USD 4-Hour
Open EUR/USD on the 4-hour chart. Starting from the left:
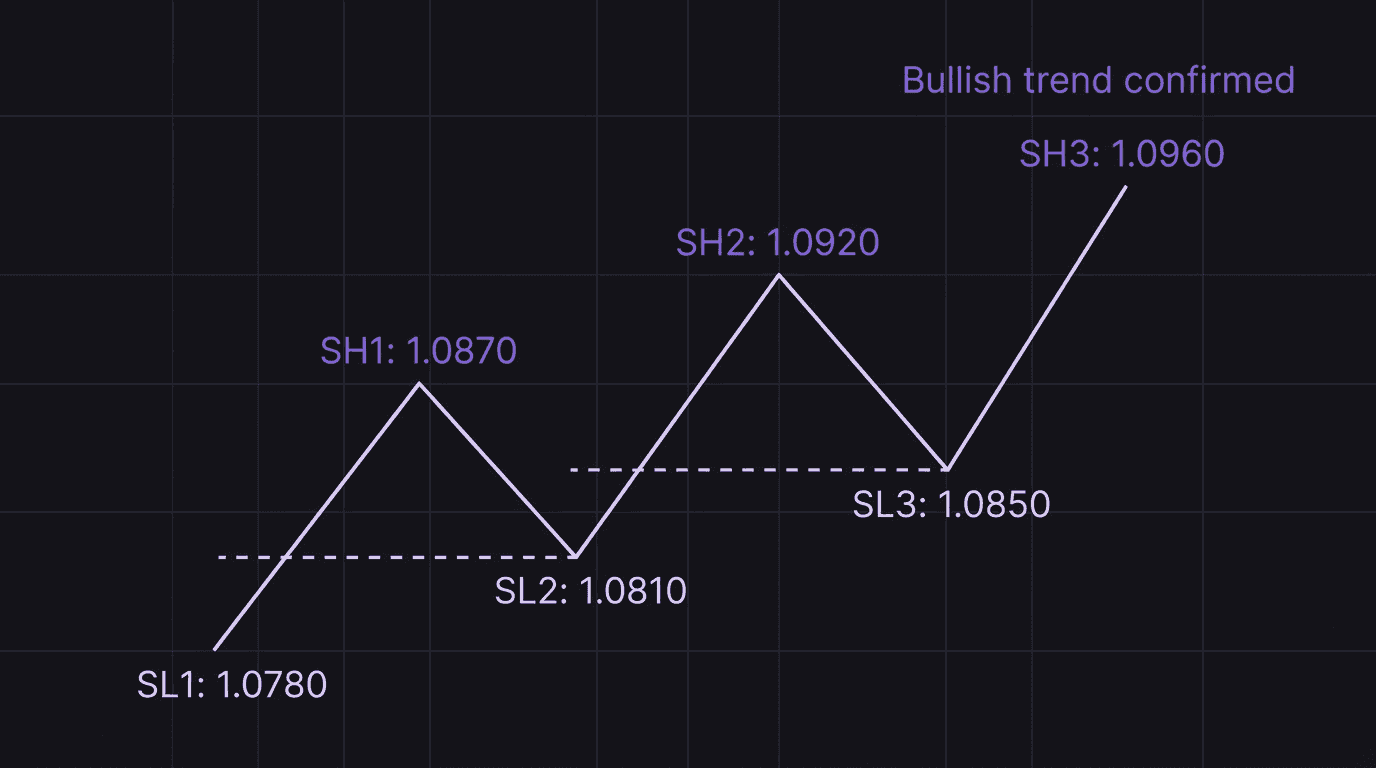
Swing Low 1: 1.0780. Price bounced here and pushed up.
Swing High 1: 1.0870. Price reached this level and pulled back.
Swing Low 2: 1.0810. Higher than 1.0780? Yes. Higher low confirmed.
Swing High 2: 1.0920. Higher than 1.0870? Yes. Higher high confirmed.
Swing Low 3: 1.0850. Higher than 1.0810? Yes. Higher low confirmed.
Swing High 3: 1.0960. Higher than 1.0920? Yes. Higher high confirmed.
You have three higher highs and three higher lows. The bullish trend is confirmed and intact. Your bias is long until the pattern breaks.
This took 30 seconds. No indicators needed. No fancy tools. Just price structure.
When the Pattern Breaks
Every trend ends. Knowing exactly when the higher-high-higher-low pattern breaks prevents you from holding a bullish bias into a reversal.
The pattern breaks when price closes its body below a previous swing low.
That is it. One rule.
If EUR/USD has been making higher highs and higher lows, and then a 4-hour candle closes its body below the most recent higher low (say, below 1.0850 in our example), the bullish structure is broken. The sequence of higher lows is no longer intact.
This is a market structure shift. It does not automatically mean you should go short. It means your bullish bias is no longer valid. You step to the sideline and wait for new structure to form.
What Breaks vs What Does Not
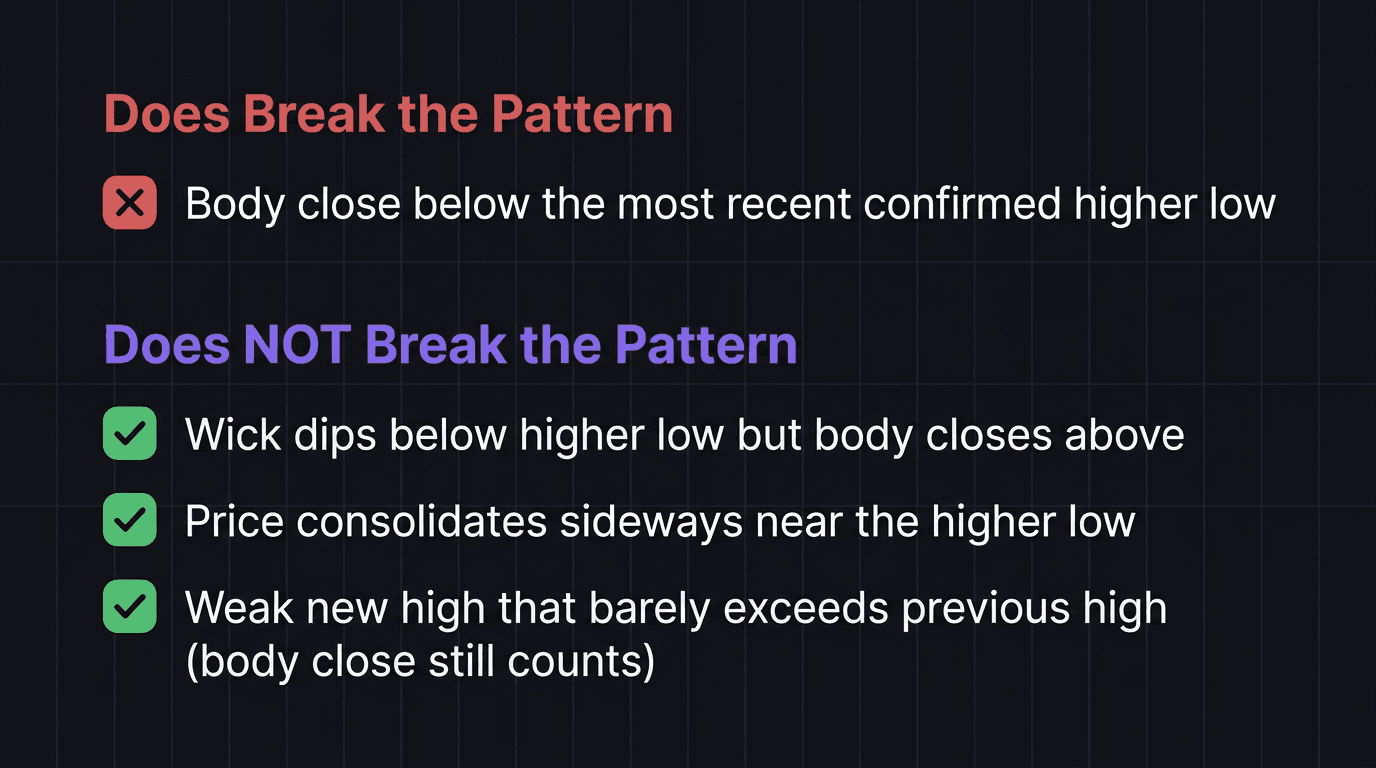
Body close below the most recent confirmed higher low.
This is definitive. No ambiguity.
A wick that dips below the higher low but the candle body closes above it. This is a test, not a break.
Price consolidating sideways near the higher low. Consolidation is not a break. Wait for the body close.
A "weak" new high that barely exceeds the previous high. As long as it technically makes a higher high (body close above), the pattern is intact.
Walkthrough: The Break on GBP/USD
GBP/USD daily chart. Bullish structure for three weeks. Higher lows at 1.2580, 1.2640, 1.2690. Higher highs at 1.2750, 1.2810, 1.2850.
Price peaks at 1.2850 and starts pulling back. It drops through 1.2750, then 1.2700. A daily candle closes its body at 1.2682, below the most recent higher low at 1.2690.
The pattern is broken. Higher lows are no longer intact. Your bullish bias is invalid.
What do you do? You stop looking for longs. You do not immediately go short either. You wait for a new structural sequence to form. Maybe price creates a lower high and then a lower low, confirming a new bearish trend. Maybe price recovers and forms a new higher low. Either way, you wait for confirmation before committing.
Traders who hold their bullish bias after the break, hoping price will recover, are the ones who take the worst losses. The pattern told you clearly that the trend structure is gone. Ignoring that signal because you "feel" bullish is one of the most expensive trading mistakes you can make.
Higher Highs Higher Lows Across Timeframes
The pattern exists on every timeframe, but not every timeframe carries the same weight.
Daily and 4-hour charts give you the most reliable structural reads. Swing points on these timeframes represent significant market decisions. When the daily chart shows higher highs and higher lows, the bullish trend is robust.
1-hour and 15-minute charts show the pattern more frequently but with more noise. A 15-minute higher-high-higher-low sequence can break and reform multiple times within a single 4-hour candle. These timeframes are useful for entry timing but not for setting your overall bias.
The rule of thumb: Map the pattern on your bias timeframe (daily or 4-hour). Use it to determine direction. Then drop to your execution timeframe to find entries within that direction.
If the 4-hour shows higher highs and higher lows (bullish bias) but the 15-minute shows lower highs and lower lows (short-term bearish), you are looking at a pullback on the 15-minute within the 4-hour uptrend. That is a potential buying opportunity, not a reason to go short.
If both the 4-hour and the 15-minute show higher highs and higher lows, all layers are aligned. That is the highest probability setup.
The kill zones matter here too. The best entries during an uptrend often form during the London or New York open, when volume picks up and the pullback from the Asian session resolves into a new higher low.
A Common Beginner Trap
You map higher highs and higher lows on the 1-hour chart. Great, the trend is up. You enter long. Then price drops for three hours and you panic because "the trend is broken."
But on the 4-hour chart, nothing has changed. The 1-hour pullback is just noise within the 4-hour structure. You sold at the worst possible moment because you were reading the wrong timeframe.
Always start with the higher timeframe. Your daily bias comes from the 4-hour or daily chart, not the 15-minute. The lower timeframes refine your entry. They do not overrule your bias.
How EdgeFlo Supports Consistent Structure Mapping
Mapping higher highs and higher lows is simple in theory. Doing it consistently, session after session, without getting lazy or letting your bias color your read, takes discipline. EdgeFlo's trade plan builder (Edge) lets you document your bias timeframe, your structural read, and your confirmation rules before the session starts.
After each trade, EdgeFlo's journal captures what happened. You can review whether your structural read was correct, whether you waited for confirmation, and whether you followed the higher timeframe bias. Over time, the pattern in your data reveals whether your structure mapping is actually driving good decisions or whether you are skipping steps.
The traders who improve fastest are not the ones with the best chart reads. They are the ones who track their reads and learn from the misses. EdgeFlo gives you the tracking system so the improvement compounds.
The Edge Brief
Receive Insights on trading psychology, discipline, and the behavioral patterns that create consistent traders from our Founder and the EdgeFlo team, delivered to your inbox.
Think different. Trade different.
What is the difference between higher highs higher lows and lower highs lower lows?
How many higher highs and higher lows do you need to confirm an uptrend?
Can higher highs and higher lows appear on any timeframe?
What does it mean when price makes a higher high but not a higher low?

Turn discipline on.
Every session.
EdgeFlo is the environment serious traders operate inside.
Start 7-Day Trial — $7
Cancel anytime.
No long-term commitment.


Think Different, Trade Different.