

Equal Highs and Lows: Magnets for Liquidity Sweeps
Equal highs and equal lows are magnets for liquidity sweeps. Learn why these formations attract institutional attention and how to trade the sweep that follows.

When price touches the same level twice and stops, most traders see a support or resistance zone. What they should see is a target. Equal highs and equal lows concentrate resting orders at one price, and that concentration acts like a magnet for institutional sweeps.
TL;DR
Equal highs and equal lows are formations where price terminates at nearly the same level two or more times.
They concentrate stop losses and pending orders at a single price, creating dense liquidity pools.
Institutions sweep these pools to fill large positions before moving price in their intended direction.
The sweep typically happens during an active session (London open or New York overlap).
Trading the sweep requires waiting for the take, confirming a structural shift, and entering after, not before.
What Equal Highs and Lows Actually Are
Equal highs form when two or more price peaks stop at approximately the same level. On a chart, it looks like price hit a ceiling, pulled back, rallied again, and hit the same ceiling. The candle wicks might differ by a few pips, but the highs are close enough to draw a flat line across them.
Equal lows are the mirror. Two or more troughs terminate at nearly the same price, creating a visible floor.
Most traders interpret these formations through the lens of traditional technical analysis. Equal highs become a "double top." Equal lows become a "double bottom." And the standard advice is to trade the reversal if price breaks through, or to trade the bounce if it holds.
But that framework misses what is actually happening below the surface.
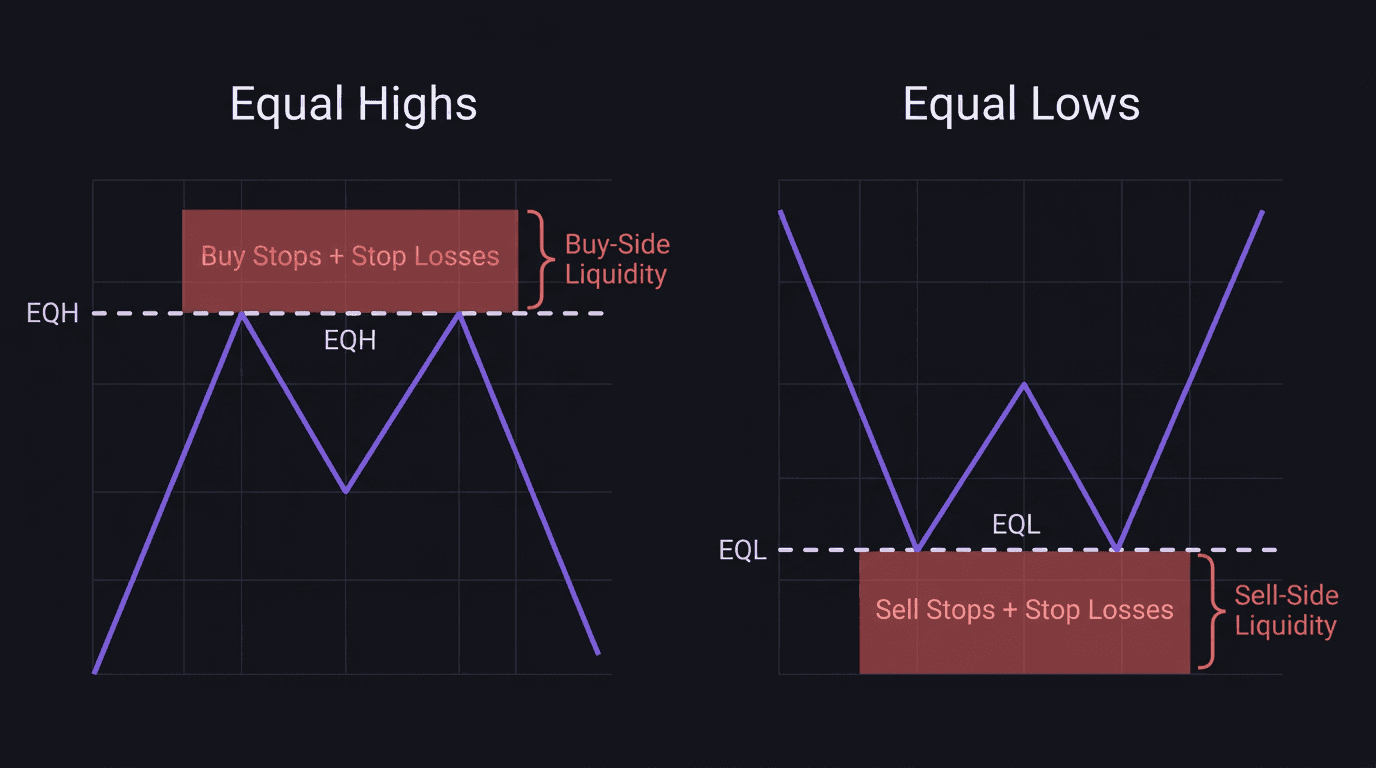
The Liquidity Explanation
Every equal high attracts two types of orders above it:
Buy stops from breakout traders. They see a resistance level and place buy stops above it, hoping to catch a breakout.
Stop losses from short sellers. Traders who sold at the equal highs place their stops just above the formation.
Both order types cluster at the same price. The result is a dense pocket of buy-side liquidity sitting a few pips above the equal highs.
Equal lows work the same way in reverse. Sell stops from breakdown traders and stop losses from buyers create a pool of sell-side liquidity just below the formation.
The key insight: the more times price touches the same level, the more orders accumulate there. A triple tap concentrates more liquidity than a double. Retail traders see strengthening support or resistance. Institutions see a deeper pool to draw from.
This is why "strong" support and resistance levels break so often. The strength of the level is what makes it a target. More resting orders means more fuel for the institutional sweep.
How to Spot Equal Highs and Lows
Scan your chart for two or more swing points at the same price. Here is what to look for:
Obvious formations: The clearest equal highs are two (or more) swing highs where the wicks terminate within 3 to 5 pips of each other. You can draw a horizontal line that touches both. On EUR/USD, that might be two highs both at 1.0960 or within a pip of it.
Consolidation patterns: When price trades sideways inside a range, the range high often consists of equal highs and the range low of equal lows. The longer the consolidation, the more liquidity stacks at both boundaries.
Internal structure points: Even within a trending move, pullbacks can create equal internal highs or lows. These smaller formations hold less liquidity than swing-level formations, but they still attract sweeps during active sessions.
What separates a meaningful formation from noise is visibility. If you have to zoom in or squint to see whether the highs are equal, other traders probably missed them too. And if other traders missed them, there are fewer orders stacked there. Focus on formations that are obvious on your execution timeframe.
Equal Highs vs Double Tops: Different Lenses
A retail trader sees a double top at 1.0960 and thinks: "Price is rejecting this level. I should sell." They enter a short with a stop above 1.0965.
An institutional-aware trader sees the same formation and thinks: "There is a pool of buy-side liquidity above 1.0960. Price will likely sweep that pool before making the real move."
Both traders might end up short. But the retail trader enters before the sweep and gets stopped out when price pokes above 1.0965. The institutional-aware trader waits for the sweep to happen, watches for a reaction, and enters after price confirms it is reversing.
The same formation, read through two different lenses, produces two very different outcomes.
This does not mean every double top gets swept. Sometimes the level holds genuinely. But the frequency of sweeps at equal levels is high enough that trading the reaction to the sweep (rather than the bounce off the level) produces better entries with tighter stops.
Walkthrough: Trading a Sweep of Equal Highs
GBP/USD on the 15-minute chart. The higher-timeframe bias is bearish. Price has been making lower highs and lower lows on the 4-hour.
On the 15-minute, you spot two swing highs at 1.2710 and 1.2712. Close enough to qualify as equal highs. You draw a horizontal line at 1.2712 and note: "Buy-side liquidity above 1.2712."
Above the equal highs, you also mark a supply zone between 1.2720 and 1.2730. This zone caused the previous break of structure to the downside.
It is 2:30 AM EST. Asian session. Price is consolidating below the equal highs at 1.2695. You do not trade. You wait.
London opens at 3:00 AM. Price pushes up and sweeps 1.2712 at 3:12 AM, hitting 1.2718. A V-shaped reaction follows: a large bearish candle closes back below 1.2705 by 3:17 AM. Internal structure shifts bearish as price breaks below the last internal higher low at 1.2695.
You enter short at 1.2693. Stop at 1.2720 (above the swept equal highs and the supply zone). Target: 1.2640 (next demand zone and structural support).
Risk: 27 pips. Reward: 53 pips. That is 1.96R.
Math check: 27-pip stop. 1% risk on a $10,000 account = $100 risk. At $10/pip per standard lot on GBP/USD, you need roughly $3.70/pip, which is about 0.37 lots. Using 0.3 lots for a round number ($3/pip): 27 pips times $3/pip = $81 risk. 53 pips times $3/pip = $159 reward. $159 / $81 = 1.96R. Confirmed.
Price hits your target at 1.2640 during the London/New York overlap. The equal highs that retail traders saw as "strong resistance" were the exact fuel that institutions used to push price lower.
Walkthrough: The Mistake of Selling the Double Top
Same chart, same day. Another trader sees the equal highs at 1.2710 to 1.2712 and enters a short at 1.2708, anticipating that "resistance will hold." Stop at 1.2725 (17 pips). Target: 1.2650 (58 pips).
London opens. Price sweeps to 1.2718. The trader's stop is at 1.2725, so they survive this time. But many traders using a tighter stop (say, 10 pips above the highs at 1.2722) get stopped out at 1.2718 to 1.2720 with spread.
Even the trader who survives entered 15 pips higher than the timed entry. Their R:R is worse, their stop is in a structurally weaker position (not behind the supply zone, just above the equal highs), and they sat through the sweep holding a red position while the market moved against them.
The lesson: do not trade the formation. Trade the aftermath.
Equal Lows in a Bullish Context
Everything described above applies in reverse for equal lows in a bullish environment.
If the higher-timeframe bias is bullish and you see equal lows at, say, 1.0820 on the 15-minute, the process is:
Mark the equal lows and note sell-side liquidity below 1.0820.
Mark the demand zone below (the zone that caused the prior break of structure to the upside).
Wait for London open.
Let price sweep below 1.0820 and into the demand zone.
Watch for a V-shaped reaction and a break of internal structure to the upside.
Enter long with a stop below the swept low and the demand zone.
The equal lows that look like "strong support" to retail traders are the entry ticket for institutions going long. They sweep the sell stops below the formation, fill their buy orders at discount prices, and push price higher.
Understanding higher highs and higher lows at the structural level helps you identify which equal-low formations sit in the discount zone (where bullish sweeps are highest probability).
When Equal Levels Do Not Get Swept
Not every set of equal highs or lows gets swept. Sometimes price genuinely respects the level and reverses without taking the resting orders.
This typically happens when:
The higher-timeframe trend is strongly against the sweep direction (a strong uptrend may not sweep buy-side equal highs because the trend is already bullish and institutions do not need to push higher to collect sell-side below).
There is a higher-priority liquidity pool nearby that institutions target first.
The formation is on a very low timeframe (1-minute or 3-minute) with minimal order concentration.
This is why you wait for confirmation before entering. The five-step process (bias, map, session, sweep, confirm) ensures you only trade after the sweep happens. If the sweep never comes, you never enter. That is the plan working as intended, not a missed opportunity.
How EdgeFlo Helps You Execute After the Sweep
The gap between seeing the sweep and executing the trade is often less than 30 seconds. Price sweeps, reacts, and breaks structure. You need to enter, set a stop, and size your position correctly, all before the candle closes.
EdgeFlo's auto risk calculator removes the math from that sequence. You click your stop-loss level, and EdgeFlo instantly calculates your lot size based on your risk percentage and stop distance. No mental arithmetic under pressure. No accidentally oversizing because you divided by the wrong pip value.
And if you set a trading window, EdgeFlo ensures you are only executing during the session where sweeps actually happen. No early entries during Asian hours, no late entries during the post-session wind-down. The guardrail restricts execution to your active window, with the option to override if you choose.
The combination of supply and demand zone markup (from your pre-session plan) and instant risk calculation (from EdgeFlo) means you can go from "sweep confirmed" to "trade placed" in under 10 seconds. That speed comes from preparation, not urgency.
The Edge Brief
Receive Insights on trading psychology, discipline, and the behavioral patterns that create consistent traders from our Founder and the EdgeFlo team, delivered to your inbox.
Think different. Trade different.
What are equal highs in trading?
Why do equal lows get swept?
Are equal highs the same as a double top?
How do I trade equal highs and lows?

Turn discipline on.
Every session.
EdgeFlo is the environment serious traders operate inside.
Start 7-Day Trial — $7
Cancel anytime.
No long-term commitment.


Think Different, Trade Different.