

What Is Liquidity in Trading: The Fuel Behind Every Move
Liquidity is resting orders that institutions sweep to fill large positions. Learn how it works, where it hides, and why retail traders become the fuel.

Liquidity in trading is not about how easily you can open or close a position. It is the pool of resting orders, including pending orders and stop losses, that sits at specific price levels waiting to be consumed. Institutions need this fuel to fill large positions, and when they sweep those orders, price moves. If you cannot spot where liquidity is hiding, your own stop losses become the fuel for the move that just stopped you out.
TL;DR
Liquidity is resting orders (stop losses and pending orders) at key price levels, not just "market volume."
Institutions sweep retail liquidity to fill billion-dollar positions because no single counterparty matches their size.
Liquidity clusters form at support and resistance levels, swing highs, swing lows, equal highs, equal lows, and consolidation edges.
If you cannot spot liquidity on a chart, you are the liquidity. Your stops become their fuel.
Combining liquidity awareness with proper market structure reading is what separates consistently profitable traders from those who keep getting stopped out.
Liquidity Is Not What You Think
Most beginners hear "liquidity" and think it means how active a market is. More volume, more liquidity. That definition is fine for economics textbooks, but it misses the point for traders.
In practical terms, liquidity is the stack of resting orders sitting at a price level. These orders include stop losses placed by traders already in positions and pending orders placed by traders waiting to enter. Together, they create a pool of available volume at a specific spot on the chart.
Think about it like fuel sitting in a tank. The fuel does nothing on its own. But when someone lights the ignition (institutional participation during an active session), the fuel powers the move. Without enough resting orders at a price level, even a massive institution cannot push price far. They need the orders to absorb the other side of their trade.
This is why liquidity pools form at predictable locations. Retail traders tend to place stops and entries at the same obvious levels, and those clusters become visible targets.
Why Institutions Need Your Stop-Loss
Here is the math that makes this click. Suppose a large fund wants to sell $1 billion worth of EUR/USD. They need buyers on the other side to absorb that order. But there is no single trader sitting there with $1 billion in buy orders ready at the exact moment the fund wants to sell.
So what does the institution do? It looks for where buy orders are already resting in the market. Above a resistance level, retail traders have placed buy stops (for breakout entries) and stop losses from short sellers. That cluster of orders is the counterparty volume the institution needs.
Price drives up into that cluster, fills the resting buy orders, and in doing so, absorbs the institution's sell orders against those buyers. Then price reverses. The retail traders who got filled on those buy stops are now trapped long into a falling market.
Sound familiar? If you have ever watched price spike above a level, trigger your entry, then immediately reverse and stop you out, you have experienced a liquidity sweep. You were the fuel.
Walkthrough: The Support Level Trap
A beginner spots a clean support level on GBP/USD at 1.2650. Price has bounced there three times. They enter long at 1.2660 with a stop at 1.2635, 25 pips below support. Dozens of other traders do the same thing. All those stop losses cluster below 1.2635. When London opens, price dips to 1.2628, sweeping every stop below 1.2635. The institution grabs that sell-side liquidity (triggered stop losses are market sell orders), fills their own buy position, and price rallies to 1.2740. The beginner is out with a 25-pip loss. The institution rides 112 pips up.
That walkthrough is the single most common experience for retail traders. The setup "looked perfect," but the stop was placed exactly where institutions needed to sweep.
If You Cannot Spot Liquidity, You Are the Liquidity
This is the line that separates traders who consistently get stopped out from traders who consistently catch the real move. If you cannot identify where resting orders sit, you are placing your own orders right where they will be consumed.
Every time you set a stop loss below an obvious support level, you add to the liquidity pool. Every time you place a buy stop above a resistance level for a breakout entry, you feed the cluster. There is nothing wrong with stops (you need them), but placing them at the most obvious level is volunteering to be swept.
Here is the mental shift: instead of seeing support and resistance as places where price bounces, start seeing them as places where orders accumulate. Those orders are the fuel, and institutions are the engine.
Walkthrough: Seeing the Sweep Before It Happens
You notice EUR/USD creating equal lows at 1.0920 on the 15-minute chart. Three touches at the same level. You know that below those equal lows sits a cluster of sell stops (from long traders) and sell stop entries (from breakout traders). Instead of entering long at 1.0920 with your stop below, you wait. During the London/New York overlap, price dips to 1.0908, sweeping below the equal lows, then prints a strong bullish candle back above 1.0920. You enter long at 1.0925 with your stop at 1.0905. Price rallies to 1.0985.
Same pair. Same level. Completely different outcome because you waited for the sweep instead of placing your stop where it would be harvested.
How Liquidity Creates the Moves You Trade
Liquidity does not just explain why you get stopped out. It explains why price moves at all.
Think of it in two stages: accumulation and expansion. During quiet periods (especially the Asian session), price consolidates. Orders stack up above and below the range as traders place breakout entries and stops. The fuel tank fills.
Then an active session opens (London or New York). Institutions step in, sweep the resting orders on one side of the range, and use that volume to power the expansion in the opposite direction. The consolidation breaks, price moves with conviction, and the daily range forms.
This is why session timing matters so much. Liquidity can sit untouched for hours during low-participation periods. Without institutional activity to ignite the fuel, price chops sideways and your entries get whipsawed.
The formula is simple: liquidity (fuel) plus timing (ignition) equals expansion (the move you trade). Remove either one and you get noise, not signal.
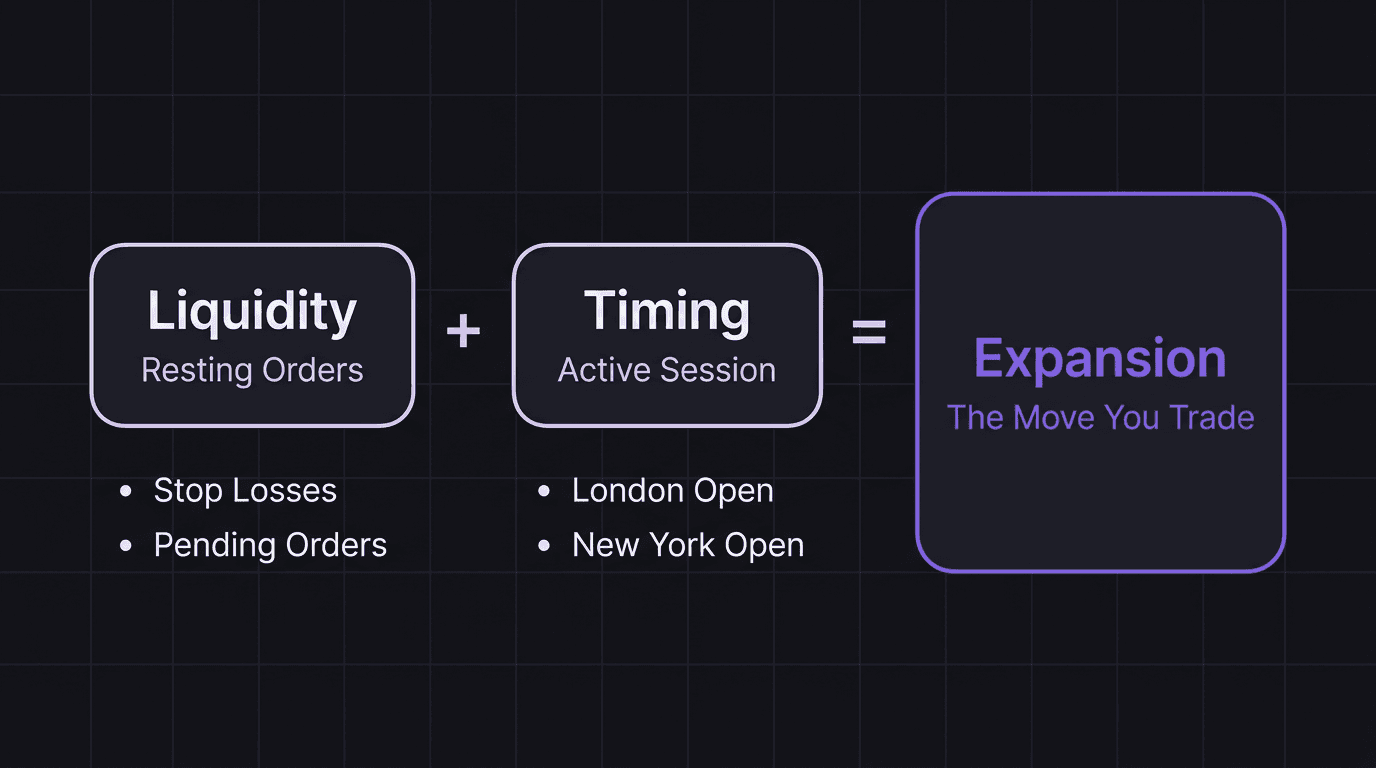
Liquidity is the raw material. Timing is the catalyst. When you combine both, you stop guessing where price will go and start seeing where it has to go.
How EdgeFlo Helps You Read Liquidity
Understanding liquidity is the analytical piece. Executing on that understanding requires discipline, which is where most traders fall apart. You identify the sweep, you know where price should go, and then you jump in too early or add an extra trade outside your session.
EdgeFlo's trading journal tracks trade entries by setup type, so you can tag whether a trade was a sweep entry, a zone entry, or an impulse trade. Over 20 or 30 trades, you can see which setup type produces your best R multiples and which ones you should stop taking. The journal also logs which session each trade was taken in, so you can verify that your liquidity-based entries are happening during active windows where the ignition actually exists.
When you can see the data showing that your London session sweep trades return 3R on average while your Asian session entries lose 0.5R, the decision about when to trade stops being a discipline problem and starts being obvious.
What is liquidity in trading?
Why do institutions sweep liquidity?
Where does liquidity sit on a chart?
What does it mean to be the liquidity?

Turn discipline on.
Every session.
EdgeFlo is the environment serious traders operate inside.
Start 7-Day Trial — $7
Cancel anytime.
No long-term commitment.


Think Different, Trade Different.