

What Is Liquidity in Forex and Why It Moves Price
Liquidity in forex means orders on both sides of the market. Learn why liquid markets fill instantly, how counterparties work, and why it matters for your trades.

Liquidity in forex is simply orders. Specifically, it is the volume of buy and sell orders sitting in the market at any given moment. When liquidity is high, you can enter and exit a trade in seconds with almost no price impact. When it is low, fills get messy, spreads widen, and you pay for every second of delay. Understanding what liquidity really means is the first step toward reading the market like a professional instead of a spectator.
Liquidity is the total volume of buy and sell orders available in the market right now.
Forex is highly liquid: your $10,000 order fills instantly because a counterparty is always available.
Illiquid markets (like housing) take weeks or months to match buyer and seller at an agreed price.
Every trade requires a counterparty: your buy needs someone else's sell, and vice versa.
Retail traders never face liquidity problems, but institutions do, and that shapes how price moves.
Liquidity Is Just Orders on Both Sides
Strip away the jargon and liquidity is one thing: orders. Buy orders sitting below the current price. Sell orders sitting above it. The more orders stacked on both sides, the more liquid the market is.
Think about buying anything in your daily life. You walk into a store, you see a price, you pay it. There is enough supply on the shelf and enough demand from customers that the transaction happens instantly. Forex works the same way. You click buy on EUR/USD at 2:00 AM, and the order fills. Someone on the other side was ready to sell.
That "someone on the other side" is the counterparty. Every single trade in the market needs one. Your buy order cannot execute unless a sell order matches it at the same price. No counterparty, no trade. This is not a technicality. It is the fundamental mechanic that makes markets function.
The bid-ask spread you see on your chart is a direct measurement of liquidity. Tight spread means plenty of orders on both sides. Wide spread means fewer participants are willing to trade at that price. You feel liquidity every time you open a position, whether you realize it or not.
Liquid Markets vs Illiquid Markets
The fastest way to understand liquidity is to compare two markets that sit on opposite ends of the spectrum.
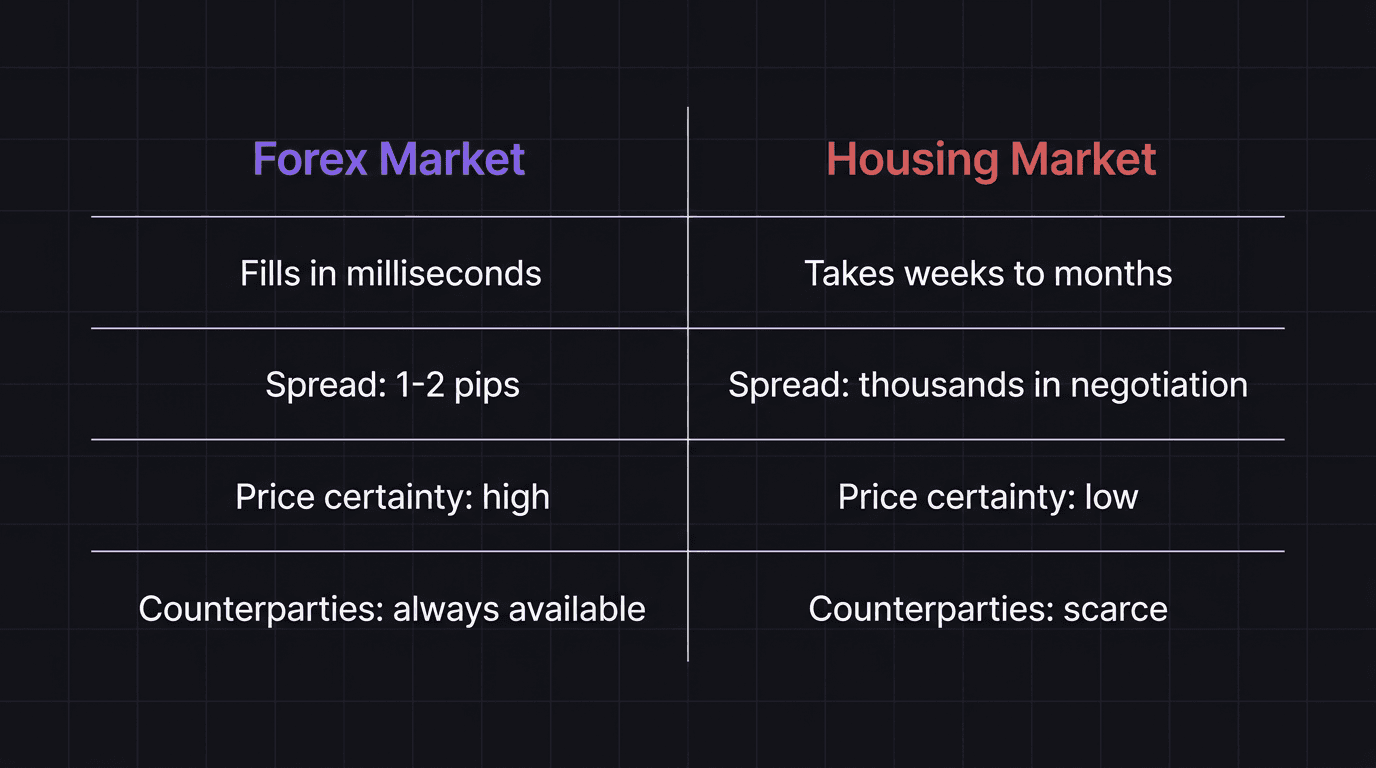
Forex (liquid): You want to sell $10,000 worth of EUR/USD. You click sell. The order fills in milliseconds. The price barely moves. There was a buyer ready and waiting, because the forex market trades over $7 trillion every single day. At any hour, day or night, counterparties are available.
Housing (illiquid): You want to sell your house for $450,000. You list it. Weeks pass. Maybe months. A buyer shows interest but wants to negotiate down to $420,000. You go back and forth. Eventually you settle on $435,000 after two months of waiting. One transaction. Months of friction.
The difference is not just speed. It is certainty. In a liquid market, you know your order will fill close to the price you see. In an illiquid market, you have no idea what price you will actually get, or when.
This matters for your day-to-day trading because forex gives you something most markets cannot: the ability to get in and get out at the price you see, almost every time. That is the practical benefit of trading in a liquid market.
Why Retail Traders Never Feel the Squeeze
If you are trading a $5,000 or $50,000 account, liquidity is never your problem. Your order sizes are a rounding error in a market that processes trillions daily.
Want to buy 0.5 lots of GBP/USD during the London session? Done. Filled instantly. Want to close that same position at 3:00 AM during the Asian session? Also done. The market is deep enough to absorb your orders without blinking.
This is why you rarely experience slippage on major pairs during active sessions. There are so many participants placing orders at every price level that your trade is just one drop in an ocean. Nobody notices. Nobody cares. Your order gets filled and the market moves on.
Walkthrough: The invisible fill. You open your platform at 9:30 AM London time. EUR/USD is quoted at 1.0845/1.0846 (a 1-pip spread). You buy 0.1 lots, which is $10,000 notional. The order fills at 1.0846 in under a second. You did not move the price. You did not widen the spread. A seller on the other side matched your order and neither of you even knew the other existed. This is high liquidity in action.
The only time retail traders feel liquidity squeeze is during extremely low-volume conditions, like a holiday session, or during a major news release when market makers pull their orders. Outside of those edge cases, you trade in a market that treats your order size as invisible.
How Institutions Face a Different Problem
Now flip the script. Imagine you manage a hedge fund and you want to buy $50 million worth of EUR/USD. That is not 0.1 lots. That is roughly 400 standard lots.
If you dump a 400-lot market order, you are going to eat through every sell order on the book. The price will jump against you as you fill through higher and higher ask prices. By the time your order is complete, the average fill price is significantly worse than where you started. This is called slippage, and at institutional size, it costs real money.
This is why institutions cannot trade the way you do. They need strategies to source liquidity without moving the market against themselves. They break orders into smaller pieces. They wait for moments when large pools of orders cluster at predictable levels. They let the market come to them instead of chasing price.
Walkthrough: The institutional problem. A bank needs to buy 500 lots of EUR/USD. The current ask is 1.0850 with roughly 50 lots available at that level. If they buy all 50 lots, the ask moves to 1.0851 where another 40 lots sit. Then 1.0852, 1.0853, and so on. By the time all 500 lots fill, the average price might be 1.0858 instead of 1.0850, an 8-pip difference. At $10 per pip per lot on 500 lots, that is $40,000 in slippage. On one trade.
This institutional liquidity problem is directly connected to supply and demand zones on your chart. The areas where institutions accumulate or distribute positions are the same zones where price tends to reverse. Retail traders see the reversal. Smart money traders understand why it happened.
How EdgeFlo Helps You See the Full Picture
Understanding liquidity changes how you read the market. Sudden wicks below swing lows stop being "random noise" and start looking like what they are: institutional order sourcing. Consolidation zones stop being "boring" and start looking like fuel for the next move.
EdgeFlo's trading journal auto-imports your trades and lets you tag them with context, including whether you entered at a zone with clustered liquidity or in the middle of nowhere. Over time, this builds a data set that shows you which execution patterns actually work in your account.
When you pair that journal data with the dashboard analytics (win rate, average R, and profit factor broken down by setup type), you start seeing which of your trades align with the mechanics and which ones fight against them. That feedback loop is what turns understanding into consistency.
What is liquidity in simple terms?
Is forex the most liquid market?
Why does liquidity matter for retail traders?
Can retail traders affect forex liquidity?

Turn discipline on.
Every session.
EdgeFlo is the environment serious traders operate inside.
Start 7-Day Trial — $7
Cancel anytime.
No long-term commitment.


Think Different, Trade Different.