

Liquidity Pools in Forex: Where Resting Orders Sit
Liquidity pools are clusters of resting orders above highs and below lows. Learn how equal highs and lows create predictable magnets that attract price.

Liquidity pools are clusters of resting orders stacked at specific price levels. They form above swing highs and below swing lows because that is where retail traders predictably place their stop losses and pending orders. These pools act like magnets, pulling price toward them because the market constantly needs opposing orders to fuel the next move. Knowing where liquidity hides is the difference between entering with the flow and entering against it.
Liquidity pools are concentrated clusters of stop losses and pending orders at key price levels.
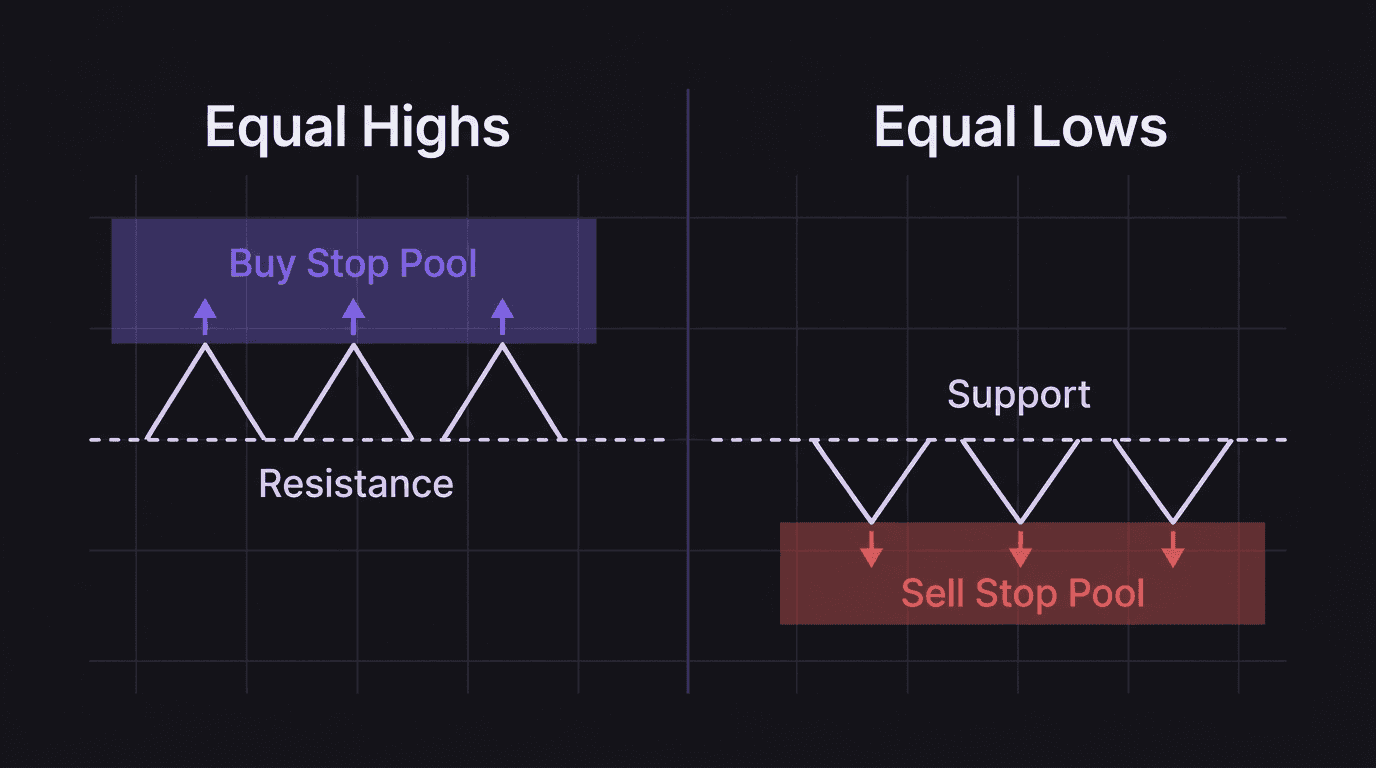
They form above swing highs (buy stops) and below swing lows (sell stops).
Equal highs and equal lows are the strongest magnets because each touch adds more resting orders.
Price is drawn to these pools because institutions need them to fill large positions.
After a pool gets swept, expect a sharp reversal as the fuel gets consumed.
What Liquidity Pools Actually Are
A liquidity pool is not a mysterious indicator. It is simply a price level where many orders are sitting, waiting to be triggered. These are not active trades. They are resting orders: stop losses, stop entries, and limit orders that will only execute when price reaches them.
Every time a trader places a buy order with a stop loss below a swing low, they add a resting sell order to that level. Every time a breakout trader places a sell stop below that same swing low, they add another sell order to the same area. Over time, these individual orders stack up into a pool.
The pool is invisible on your chart. You cannot see resting orders on a standard candlestick chart. But you can predict where they accumulate because traders are predictable creatures. Stop losses go below lows and above highs. Limit orders go at obvious support and resistance levels. This predictability is what makes liquidity in trading readable even without an order book.
Where Resting Orders Accumulate
Orders cluster at three predictable locations:
Below swing lows: Every buyer who entered during an uptrend has a stop loss somewhere below the most recent swing low. Bearish breakout traders have sell stops at the same level. Result: a pool of sell orders stacked in a tight zone.
Above swing highs: Every short seller has a buy stop loss above the recent swing high. Bullish breakout traders have buy stops at the same level. Result: a pool of buy orders stacked in a tight zone.
At equal levels: When price touches the same high or low multiple times without breaking through, each touch reinforces the level. More traders enter. More stops accumulate. The pool grows larger with every test.
Walkthrough: Building a pool at a swing low. EUR/USD is in an uptrend on the 4H chart. Price pulls back to 1.0820, bounces, and makes a new high. Traders who bought the bounce place their stops at 1.0815. A week later, price pulls back to 1.0822, bounces again. New buyers add stops at 1.0818 and 1.0815. The swing low at 1.0820 has now been tested twice. Below it sits a growing pool of sell orders from both rounds of buyers, plus sell stop entries from bears watching the level. Each test makes the pool larger and more attractive to institutional traders who need that sell liquidity to fill buy positions.
Equal Highs and Equal Lows as Magnets
Equal highs happen when price reaches the same high level two or more times and fails to break through. On a chart, it looks like a flat ceiling. Equal lows are the mirror: price touches the same low level multiple times, creating a flat floor.
These are the highest-probability liquidity magnets on a chart. Here is why.
Every time price touches a resistance level and reverses, traders who sold at that level feel validated. New traders see the level as "proven resistance" and add their own shorts with buy stops above the equal highs. The more times price tests the level, the more buy stop orders pile up above it.
The irony is that what looks like "strong resistance" is actually becoming a bigger and bigger target. All those buy stops above the equal highs represent a massive pool of resting buy orders. When price finally breaks through, the stops trigger in a cascade. That cascade of buy orders fuels a sharp move higher.
This is why false breakouts and liquidity sweeps happen so often at equal levels. The pool is large, concentrated, and worth targeting.
Reading Liquidity on Your Chart
You cannot see resting orders, but you can map where they are likely to sit. Here is a practical process:
Step 1: Mark the most recent swing highs and swing lows on the 4H or daily chart. These are your primary pool locations.
Step 2: Look for equal highs or equal lows. The flatter and cleaner the level, the larger the pool is likely to be.
Step 3: Note which side of the market is more loaded. If there are three clean equal lows but messy, staggered highs, the sell-side pool below those equal lows is probably larger and more attractive.
Step 4: Watch how price behaves as it approaches a pool. If it accelerates toward the level (instead of grinding slowly), institutions may be pushing price into the pool to trigger orders.
Walkthrough: Reading the pool before a sweep. GBP/USD on the 1H chart shows three equal lows at 1.2700. Price has bounced from this level three times over five days. Below 1.2700, a large sell stop pool has built up. On day six, price drops sharply from 1.2740 to 1.2690, slicing through all three equal lows in one candle. This triggers the entire pool: sell stops from bears and protective stops from bulls. Price wicks to 1.2685 and immediately reverses, closing back above 1.2710. The pool has been swept. The sell liquidity has been absorbed. If you understand premium and discount zones, you recognize this as a discount entry opportunity, right where the pool was drained.
The key mindset shift is this: what looks like "support" to a retail trader looks like "a target" to an institution. The more obvious the level, the larger the pool, and the more likely it is to get swept before a real move begins.
How EdgeFlo Helps Track Zone Reactions
Identifying liquidity pools is one skill. Tracking how well you trade around them is another. The pattern you need to catch is whether you consistently enter before or after sweeps, and whether your stops are inside the pools or outside them.
EdgeFlo's journal auto-imports your trades and lets you review them against the chart. After a week of tagging trades with "entered at pool" or "entered after sweep," you start seeing patterns in your own execution that are invisible in the moment.
The weekly AI report (Plus) can surface recurring themes, like "4 out of 5 losing trades this week had stops inside the liquidity cluster." That is the kind of feedback that turns a concept like liquidity pools from theory into a practical filter for your entries. You stop placing stops where the pool sits and start waiting for the sweep to happen before you commit capital.
The Edge Brief
Receive Insights on trading psychology, discipline, and the behavioral patterns that create consistent traders from our Founder and the EdgeFlo team, delivered to your inbox.
Think different. Trade different.
What is a liquidity pool in forex?
Why does price get attracted to liquidity pools?
How do I spot liquidity pools on a chart?
What happens after a liquidity pool gets swept?

Turn discipline on.
Every session.
EdgeFlo is the environment serious traders operate inside.
Start 7-Day Trial — $7
Cancel anytime.
No long-term commitment.


Think Different, Trade Different.