

Weekly Trading Review: Find What You Keep Missing
A complete weekly trading review framework covering key metrics, behavior patterns, and how AI-assisted reports surface insights manual reviews miss.

A weekly trading review is a structured end-of-week session where you measure what actually happened against what you planned. You check your key metrics, win rate, average R-multiple, number of trades, and compare them to the week before. But the real value is not in the numbers themselves. It is in the patterns those numbers reveal about your behavior, your decision-making, and the gap between your plan and your execution.
Most traders skip this entirely. They close the week, maybe glance at P&L, and move on. That is how the same mistakes compound for months without being caught.
TL;DR
A weekly review covers metrics (win rate, R-multiple, profit factor), behavior patterns (overtrading days, emotional entries), and plan adherence, not just P&L.
Without structured data, you will miss the patterns that cost you money because they happen slowly across sessions.
Manual reviews catch surface-level issues but consistently miss cross-session behavior trends.
AI-assisted reports can analyze your journal entries and flag patterns like recurring emotional trades on specific days or after specific outcomes.
The review is only useful if you act on it, adjust one rule or focus area per week, not five.
What to Review Every Week
The weekly review is not a vague "look at your trades" exercise. It is a checklist. If you do not know exactly what you are checking, the review becomes a scrolling session that feels productive but changes nothing.
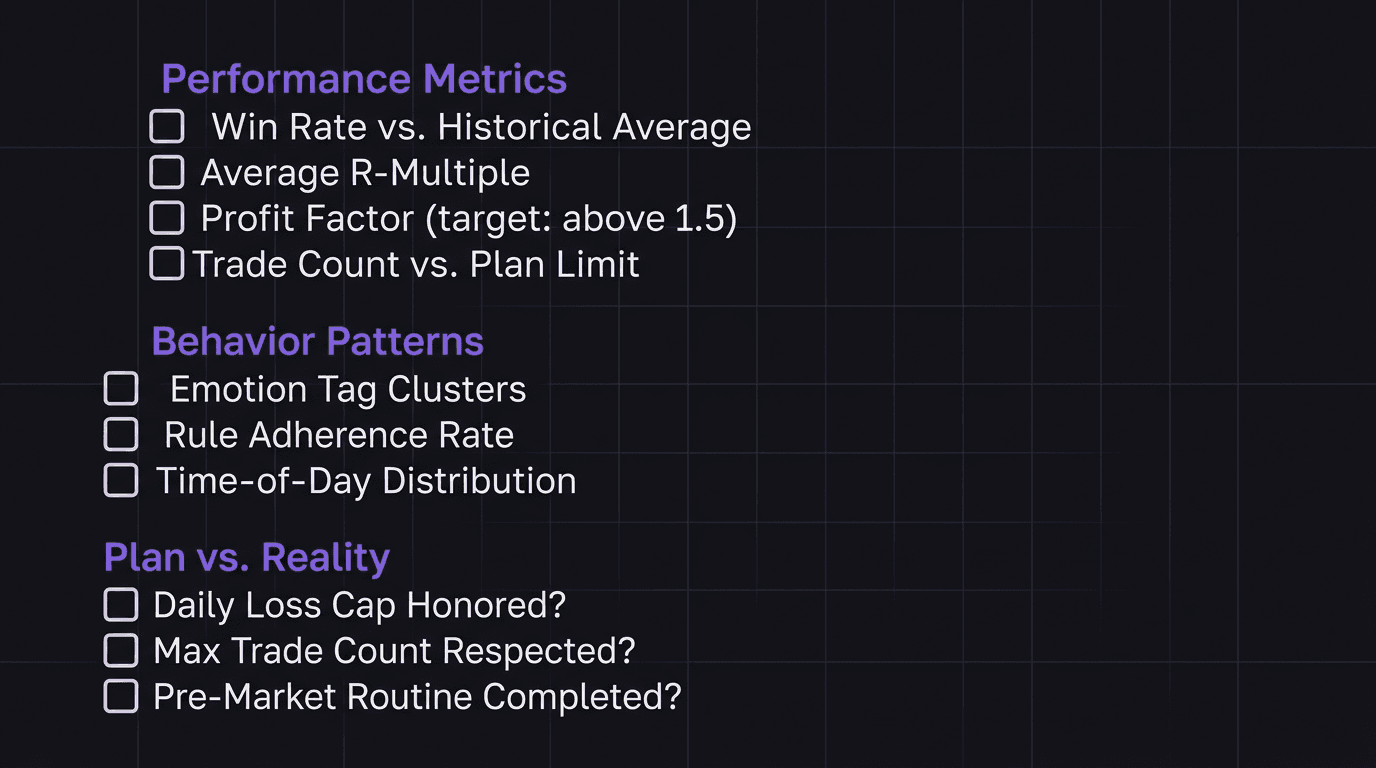
Here is the framework, broken into three layers.
Layer 1: Performance Metrics
These are the numbers. Pull them from your trading dashboard or journal at the end of each week:
Win rate: Did it stay within your historical range, or did it drop? A 5-percentage-point swing in either direction is worth investigating.
Average R-multiple: Are your winners big enough relative to your losers? If your average win is 1.2R and your average loss is 1R, the math only works at a very high win rate.
Profit factor: Gross profit divided by gross loss. Anything above 1.5 is healthy. Below 1.0 means you gave back more than you made.
Number of trades: Did you take more trades than your plan allows? Overtrading is the most common pattern that hides inside a "decent" week.
Layer 2: Behavior Patterns
Numbers tell you what happened. Behavior data tells you why.
Emotion tags per trade: If you tag emotions at entry and exit, look for clusters. Did frustration spike on Wednesday? Did confidence lead to oversized positions on Thursday?
Rule adherence: How many trades followed your plan entry criteria? If 3 out of 12 trades were off-plan, your issue is not strategy.
Time-of-day distribution: Are you taking trades outside your best session window? A trader who performs well during London but keeps entering during late New York is bleeding edge.
Layer 3: Plan vs. Reality
This is the accountability layer. Compare what you said you would do (your trade plan) with what you actually did.
Did you honor your daily loss cap every day?
Did you stop trading after hitting your max trade count?
Did you follow your pre-market routine before the first trade?
If the answer to any of those is "no" more than once, that is your focus for next week. Not a new indicator. Not a new pair. The same plan, executed properly.
Walkthrough: The trader who "had a good week"
A trader finishes Friday with +2.8% on a $25,000 account, $700 in profit. Feels good. No review needed, right?
But the numbers tell a different story. Win rate was 38% (below their 45% average). Average winner was 2.1R, average loser was 0.9R, acceptable, but the win rate drop means the edge is thinning. They took 17 trades when their plan caps at 12. Five of those extra trades were losers taken on Thursday afternoon after an early win streak.
Without the review, this trader walks into Monday thinking their process is working. It is not. The P&L masked a discipline breakdown. The $700 profit could have been $1,200 if they had stopped at 12 trades.
The Patterns You Miss Without Data
Here is the problem with reviewing trades from memory: your brain edits the story. You remember the big win. You forget the three small losses that preceded it. You tell yourself Thursday was fine because you ended the day flat, but you do not remember that you took two revenge trades after the first loss and just happened to recover.
This is not a character flaw. It is how memory works. Your brain smooths out the rough spots to keep you functional. But in trading, those rough spots are where all the information lives.
Cross-Session Patterns
Some patterns only become visible when you look at data across multiple sessions. A single day's journal cannot reveal them.
Monday overtrading: You start the week eager, take more setups than usual, and give back Monday gains by Tuesday. This shows up as a consistently higher trade count on Mondays compared to other days.
Post-loss escalation: After a losing day, you increase position size the next day. Not dramatically, maybe from 1% risk to 1.3%. Small enough that you do not notice in the moment. Large enough that over 50 occurrences it adds up to hundreds of dollars in unnecessary drawdown.
Late-session drift: Your best trades happen in the first two hours of your session. After that, win rate drops 15 percentage points. But you keep trading the full session because "more screen time equals more opportunity." It does not.
Without structured data in your performance review, these patterns stay invisible. You will never catch "Monday overtrading" by feel because every Monday feels like a fresh start.
Walkthrough: The pattern that took 6 weeks to find
A EUR/USD trader noticed their equity curve had a subtle sawtooth pattern, steady gains followed by sharp drops every 7-10 trading days. The drops were always 1.5% to 2% of account value. Nothing catastrophic, but enough to erase a week of work each time.
When they finally pulled their journal data into a spreadsheet, the pattern jumped out. Every drop correlated with a day where they had taken 3 or more trades before 9:00 AM London time. On those days, their win rate was 22%. On days where their first trade came after 9:30 AM, win rate was 51%.
The fix was not a strategy change. It was a rule: no entries before 9:15 AM. That one adjustment, discovered only through cross-session data review, stopped the sawtooth bleed.
Manual Review vs AI-Assisted Review
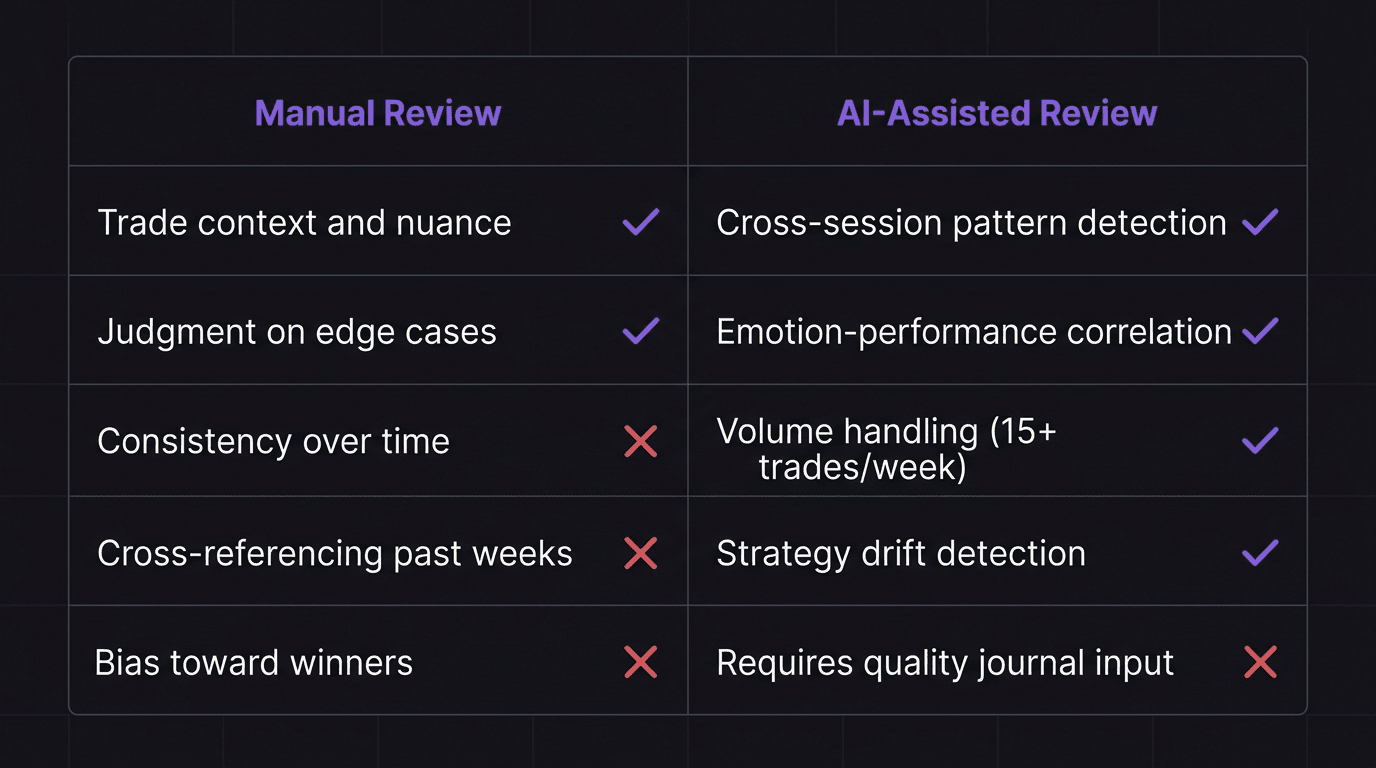
A manual weekly review works. Traders have been doing it with spreadsheets and notebooks for decades. But it has predictable blind spots.
Where Manual Reviews Excel
Context: You remember why you took a trade. The chart setup, the news catalyst, the gut feeling. No data field captures that nuance the way your own memory does when it is fresh.
Judgment calls: Was that trade genuinely off-plan, or did the setup meet a secondary criterion you had not documented? You can make that call. A spreadsheet cannot.
Motivation: Sitting with your trades forces you to face what happened. There is a psychological weight to manually writing "I broke my rule on this trade" that a dashboard summary does not replicate.
Where Manual Reviews Fail
Consistency: After week three, most traders start skipping items on their checklist. By week six, the review is a five-minute glance at P&L.
Cross-referencing: Comparing this week's emotion patterns to last month's requires flipping through pages or filtering spreadsheet columns. Most traders do not bother.
Volume: If you take 15 trades per week, a thorough review of each trade takes over an hour. Cut that to 25 trades and it becomes a weekend project nobody finishes.
Bias: You will unconsciously spend more time analyzing your winners and skim past your losers. The data does not have preferences.
What AI-Assisted Review Adds
An AI report does not replace your judgment. It reads everything you wrote, every journal entry, every emotion tag, every note, and looks for patterns across the full dataset. Things it catches that you probably will not:
Emotional state correlations: "Your win rate drops 18 percentage points on days you tagged frustration at entry."
Frequency anomalies: "You took 40% more trades this week than your 4-week average."
Strategy drift: "Three of your five losses this week used a setup you stopped including in your plan two weeks ago."
The AI does not decide what to do about these findings. That is still your job. But it surfaces the raw pattern so you do not have to dig for it.
How to Act on Weekly Insights
Finding patterns is step one. The review fails if you do not change anything based on what you found.
But here is where traders overcorrect. They finish a review, find four problems, and try to fix all four next week. By Wednesday, they are overwhelmed and revert to old habits. Nothing sticks.
The One-Thing Rule
Pick one finding from your review. Just one. Make it your focus for the entire next week.
If you discovered that you overtrade on Mondays, your only adjustment is: "Maximum 2 trades on Monday." Do not also try to fix your late-session entries and your position sizing and your pre-market routine. Fix Monday. Track whether you actually fixed it. Then move to the next thing.
This is how trading accountability works in practice, not through massive overhauls, but through small, trackable commitments that compound.
From Insight to Rule
Every useful review finding should translate into one of three actions:
Add a rule: "No entries before 9:15 AM" or "If I tag frustration, skip the next setup."
Remove a behavior: Stop trading a pair that shows negative expectancy in your data. Stop extending sessions past your profitable window.
Adjust a number: Reduce max daily trades from 5 to 4. Tighten your R-multiple minimum from 1.5R to 2R.
If a finding does not lead to a concrete action, it is an observation, not an insight. Note it, but do not let it clutter your focus.
Tracking Follow-Through
The next week's review starts by asking: "Did I follow the one rule I set last week?"
If yes, keep it and add another. If no, figure out what broke, was the rule too vague? Too hard to remember in the moment? Did you need a post-trade review prompt to remind yourself?
This creates a feedback loop. Each weekly review both evaluates the past week and verifies whether last week's correction actually landed.
How EdgeFlo Generates Your Weekly Report
EdgeFlo's AI reads your journal entries from the past week, every trade note, emotion tag, and reflection, and compiles a report that highlights patterns across your sessions. This is a Plus feature, and the report generates automatically at the end of each week.
The report does not tell you what to trade or how to trade. It tells you what your own data says about how you actually traded. If you tagged frustration on three separate entries and all three were losers, the report flags that correlation. If your trade count spiked mid-week and your win rate dropped in the same window, it connects those data points.
What makes this different from pulling numbers into a spreadsheet is the cross-referencing. The AI reads your written reflections alongside the quantitative data. A manual review might catch that your win rate dropped on Wednesday. The AI report catches that your win rate dropped on Wednesday, your journal entry mentioned "felt rushed," and two of the three trades were in a pair you had flagged as "avoid this week" in Monday's pre-market notes. That level of cross-referencing is what most traders never get to in a manual review process.
The Edge Brief
Receive Insights on trading psychology, discipline, and the behavioral patterns that create consistent traders from our Founder and the EdgeFlo team, delivered to your inbox.
Think different. Trade different.
How long should a weekly trading review take?
What metrics matter most in a weekly review?
Can a weekly review replace daily journaling?
What is an AI-generated weekly trading report?

Turn discipline on.
Every session.
EdgeFlo is the environment serious traders operate inside.
Start 7-Day Trial — $7
Cancel anytime.
No long-term commitment.


Think Different, Trade Different.