

Trading Dashboard: One Screen to Track Plan, Journal, and Performance
A trading dashboard combines your plan, journal, and performance data in one place. Learn what sections to include and how to use it daily.
A trading dashboard is a single screen where your plan, journal, and performance data live together. Instead of flipping between a spreadsheet for tracking, a notebook for journaling, and a separate app for your rules, everything sits in one place. You check it before you trade, during the session, and again when you are done. The result: fewer missed steps, faster reviews, and a clear picture of what is actually working.
Most traders already track some of this. The problem is not missing data. The problem is the data lives in five different places, so you never connect the dots.
TL;DR
A trading dashboard connects your plan, journal, goals, and performance metrics on one screen.
The four core sections: trading plan, trade journal, goals and habits, and performance review.
Use it before, during, and after every session to close feedback loops.
The biggest mistake is building a dashboard you never check because it takes too long to update.
Start simple: one page with your rules, a trade log, and three numbers (win rate, average R, profit factor).
What a Trading Dashboard Actually Does
Think of a trading dashboard like the instrument panel in a car. You do not need to open the hood to know your speed, fuel level, or engine temperature. The panel surfaces the numbers that matter while you drive.
A trading dashboard does the same thing for your trading. It pulls together your trading plan, your trade journal, your goals, and your performance metrics into one view. No context switching. No forgetting which spreadsheet tab has your rules.
The real value is not the data itself. It is the connections between the data.
When your plan, journal, and metrics sit side by side, patterns become obvious. You notice that every loss on Wednesday happens during the same session. You see that your win rate on A+ setups is 68% but drops to 31% on B-grade setups. You catch yourself breaking rules three days in a row before it turns into a blown account.
Without a dashboard, those patterns stay buried. You might figure them out eventually, or you might keep repeating the same mistakes for months. Sound familiar?
The Four Sections Every Dashboard Needs
You do not need a complex system. You need four sections that talk to each other.
Section 1: Your Trading Plan
This is your playbook. It holds your rules for trade selection, entry criteria, position sizing, and trade management. Keep it visible, not buried in a PDF you opened once.
A good plan section includes:
Point of interest selection (which zones or levels you trade from)
Minimum criteria to take a trade (what must be true before you enter)
Entry model (the specific pattern or trigger you wait for)
Risk management rules (how much you risk per trade, max daily loss)
Trade management (where you move stops, when you take partials)
One trader in Brett Goh's Outliers program keeps both a full "ultimate playbook" and a simplified one-page version. The full version covers every scenario. The one-pager sits open during live sessions. That split matters because you will not read 15 pages of rules while price is moving.
Section 2: Your Trade Journal
This is where you log what actually happened. Every trade, every day. The journal section connects directly to your plan so you can compare what you planned to do versus what you actually did.
Your journal needs to capture:
Pair, timeframe, direction
Entry and exit prices
The setup grade (did it meet your plan criteria?)
What you did right and what you would change
Screenshots of the chart at entry
If you are not sure how to structure this, the guide on how to journal trades breaks it down step by step.
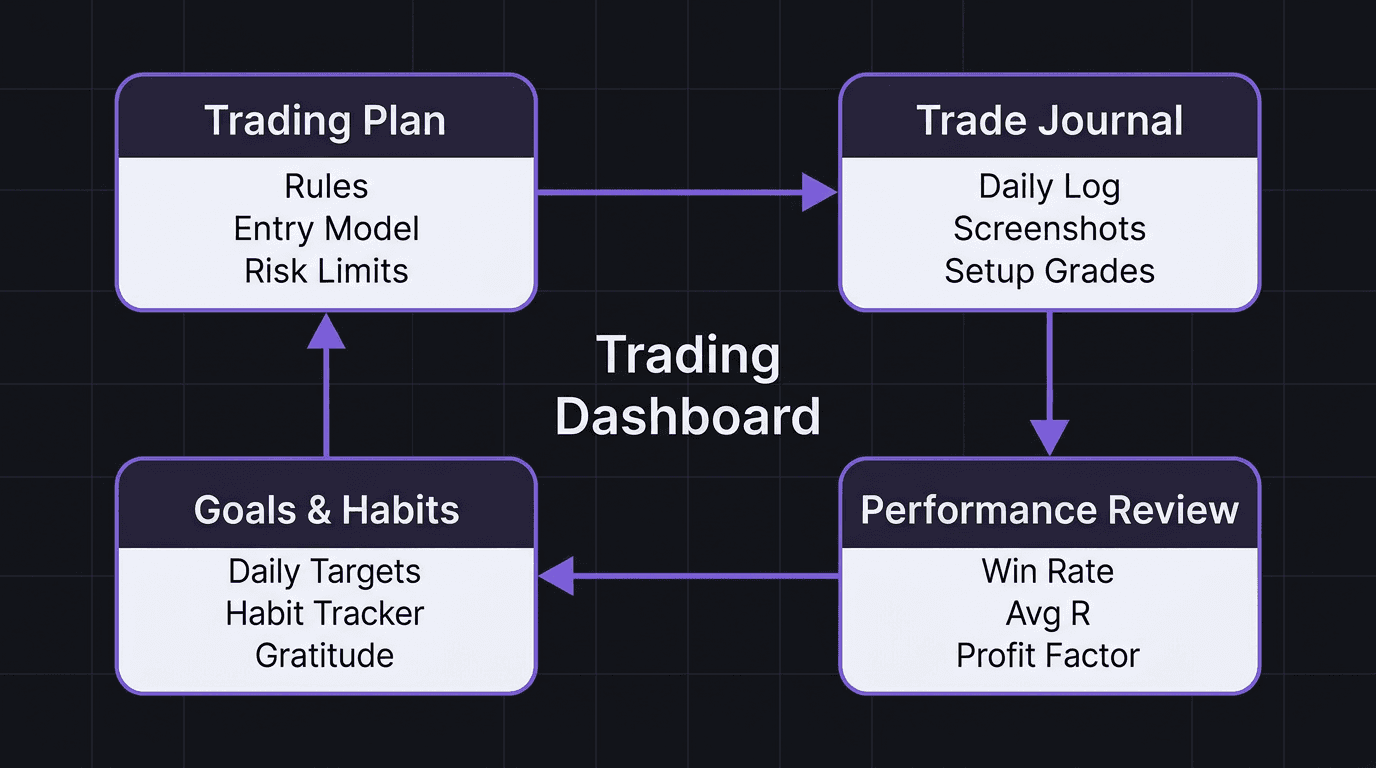
Section 3: Goals and Habits
Trading goals that sit in a separate document get forgotten. A dashboard keeps them visible every single morning.
Structure goals as a cascade:
Annual goal (the big target, like growing your account 40% or passing a funded challenge)
Quarterly goal (what you need to accomplish this quarter to stay on track)
Monthly goal (a specific, measurable milestone)
Daily goal (the one thing you focus on today)
Below the goals, add a habit tracker. This is not about trading directly. It is about the routine that supports trading. Track things like: did you study charts, did you follow your plan, did you journal every trade, did you complete your pre-market routine.
Brett Goh's dashboard also includes a gratitude section (three things each morning) and a daily planner broken into 30-minute blocks. That level of structure is not for everyone. But the principle is solid: the habits that support your trading belong next to your trading data. Not in a separate app you stop opening after a week.
Section 4: Performance Review
This section answers one question: is your edge real?
Track these numbers at minimum:
Metric | What It Tells You |
|---|---|
Win rate | How often your setups actually work |
Average R | How much you make per win relative to your risk |
Profit factor | Total gains divided by total losses (above 1.5 is solid) |
Equity curve | Visual trend of your account over time |
A data tracker that updates these numbers after every trade session saves you from the spreadsheet grind. Manual calculation works when you have 20 trades. After 200, it becomes a chore you skip.
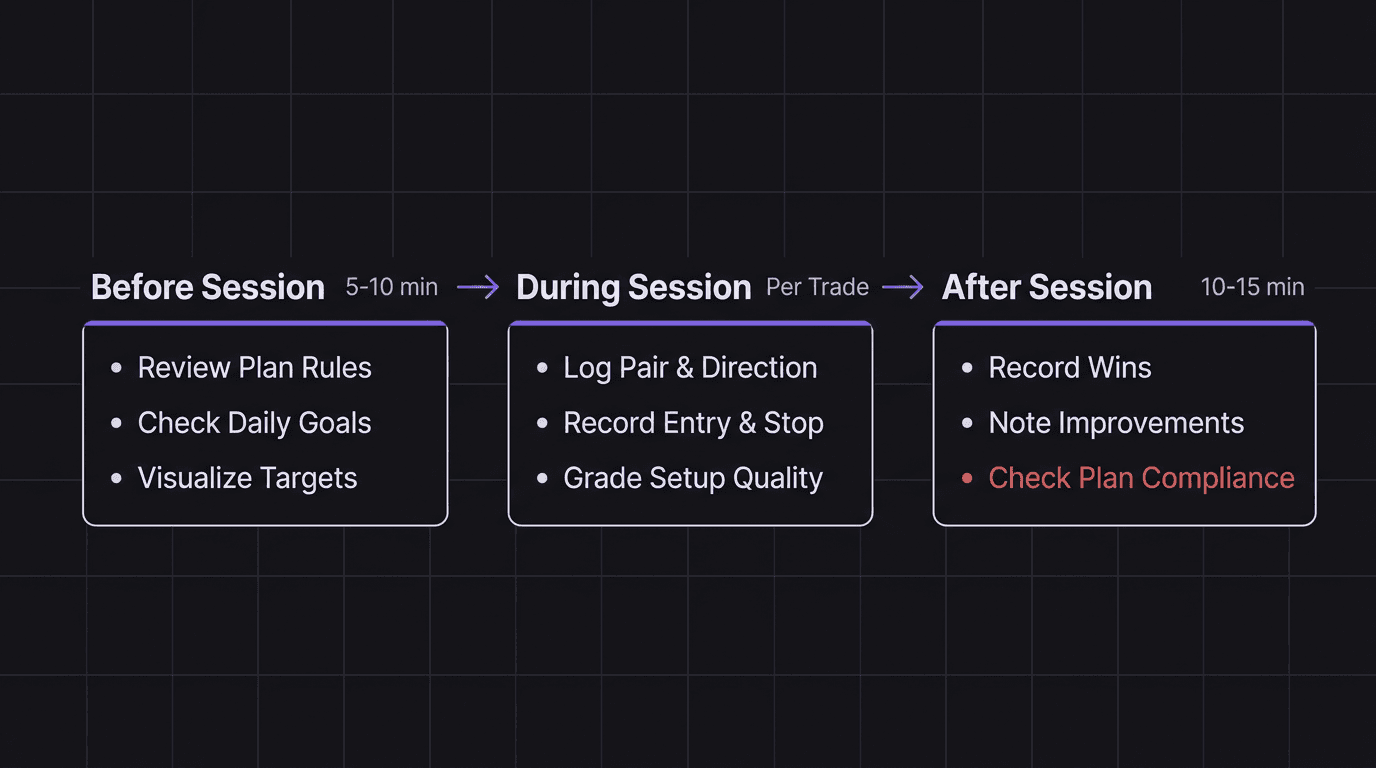
How to Use Your Dashboard Before, During, and After Trading
A dashboard that collects dust is worse than no dashboard at all. The whole point is a rhythm: check it before you trade, use it during, and update it after.
Before the Session
Spend 5 to 10 minutes on three things:
Review your plan. Read your rules. Not skim. Read. What are you trading today? What is your max risk?
Check your goals. What is today's focus? If your monthly goal is "only take A+ setups," remind yourself now, not after you have already forced a C-grade trade.
Visualize. This one sounds soft, but Brett Goh swears by it. Look at your goals, close your eyes, picture yourself hitting them. It takes 60 seconds and sets your mindset for the session.
During the Session
Log trades as they happen. Do not wait until the end of the day. By then, you have forgotten why you entered, what you were thinking, and which rule you bent.
Quick-log format: pair, direction, entry price, stop, target, setup grade. Fill in the details after the session. This takes 30 seconds per trade.
After the Session
This is where most traders quit. The session is over, you want to close the charts. But the after-session review is where all the learning happens.
Record three things:
Wins: what went well today (specific, not "I did okay")
Improvements: what you would do differently (specific, not "be more disciplined")
Plan compliance: did you follow your rules? Yes or no. If no, what rule did you break?
> Example walkthrough: A trader uses EUR/USD on the 15-minute chart during London session. Their plan says to only enter longs from the discount zone below 1.0850 after a liquidity sweep. On Tuesday, they see price drop to 1.0842, sweep below Monday's low at 1.0838, and bounce. They enter long at 1.0845, stop at 1.0825, target at 1.0890. Price hits target for a 3.25R win. In the dashboard journal, they log: pair EUR/USD, 15m, long, A+ setup (met all five criteria), 3.25R result. In the after-session review, they note the win and mark "followed plan: yes." The equity curve ticks up. The habit tracker shows 12 consecutive days of plan compliance. That is the dashboard doing its job: connecting the plan to the execution to the outcome.
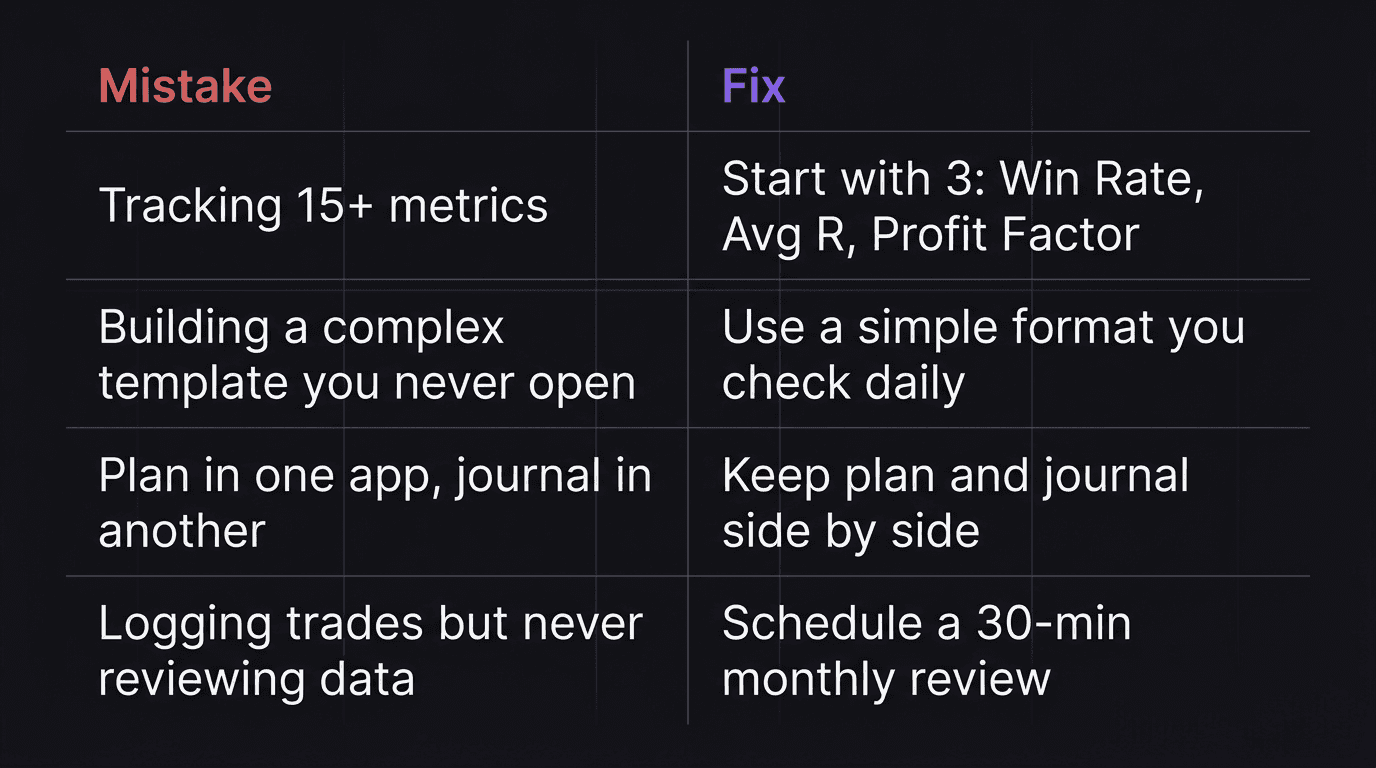
Common Dashboard Mistakes That Waste Your Time
Tracking Too Many Metrics
More data is not better data. If your dashboard has 20 columns and 15 metrics, you will stop using it within two weeks. Start with three numbers: win rate, average R, and profit factor. Add more only when you have a specific question those three cannot answer.
Building Without Using
Some traders spend a full weekend building the perfect Notion template or Excel dashboard. Color-coded tabs, conditional formatting, dropdown menus. Beautiful. Then they open it twice and go back to trading from memory.
The best dashboard is the one you actually use every day. A plain text file you check daily beats a gorgeous spreadsheet you ignore.
Separating the Plan from the Journal
If your plan lives in one app and your journal lives in another, you cannot compare them without effort. And if it requires effort, you will not do it consistently. The whole point of a dashboard is that the plan and the journal sit side by side so the gap between intention and execution is visible.
Never Reviewing the Data
Logging trades is step one. Reviewing the data is step two. Too many traders do step one religiously and skip step two entirely. A monthly review (even 30 minutes) reveals patterns that daily logging cannot. Your win rate on Fridays. Your average R during New York session versus London. Your discipline score after consecutive losses.
For a deeper look at what a proper review process looks like, see backtesting your strategy and how it connects to forward performance.
> Example of what NOT to do: A trader sets up a detailed Google Sheets dashboard tracking GBP/JPY trades on the 1-hour chart. They log 47 trades over six weeks. Win rate shows 52%, average R shows 1.8R, profit factor is 1.4. But they never review the data by day of week or session. If they had, they would see that 80% of their losses happen on Mondays (they trade aggressively to "start the week strong") and their profit factor during Tokyo session is 0.6 (they are trading a pair that moves best in London). Six weeks of data, zero insights extracted. The dashboard did its job by collecting data. The trader did not do theirs by reviewing it. That is one of the core trading mistakes that drains accounts slowly.
How EdgeFlo Builds Your Dashboard Automatically
EdgeFlo was designed to solve the exact problem this article describes: scattered tools that never talk to each other. Instead of building a dashboard from scratch, you get one that updates itself.
The EdgeFlo dashboard shows win rate, average R, profit factor, and account PnL, updated in real time. No manual formulas. No end-of-day spreadsheet updates. Every trade you log feeds directly into your performance metrics, so the numbers are always current.
It also includes a Discipline Summary showing your current guardrail status. If you set a max daily loss of 2% and you have hit 1.5%, you see that on the dashboard before your next trade. The feedback loop between your plan and your execution is automatic, not something you have to build and maintain yourself.
Your journal, your plan, and your review data live in the same environment. That means the comparison between "what I planned" and "what I did" happens without copy-pasting between apps. One screen, one workflow, one place to look.
The Edge Brief
Receive Insights on trading psychology, discipline, and the behavioral patterns that create consistent traders from our Founder and the EdgeFlo team, delivered to your inbox.
Think different. Trade different.
What is a trading dashboard?
What metrics should a trading dashboard track?
How often should I check my trading dashboard?
Can I build a trading dashboard in a spreadsheet?

Turn discipline on.
Every session.
EdgeFlo is the environment serious traders operate inside.
Start 7-Day Trial — $7
Cancel anytime.
No long-term commitment.


Think Different, Trade Different.