

Trading Performance Review: The Monthly Process That Finds Your Leaks
A trading performance review reveals patterns in your wins, losses, and discipline. Follow this monthly and quarterly process to find and fix your leaks.

A trading performance review is a structured sit-down where you pull up your data, compare it against your plan, and find the specific patterns that are costing you money. Most traders log trades but never review them. That gap between collecting data and analyzing data is where accounts quietly bleed out over months. A proper monthly review takes 30 to 60 minutes and answers one question: where is the leak?
The process is straightforward. Pull your numbers, check five key metrics, slice the data by session and setup type, and write down one or two changes for next month. Not a vague "be more disciplined" note. Specific, measurable adjustments.
TL;DR
A performance review is a monthly process that turns raw journal data into actionable adjustments.
Track five numbers: win rate, average R, profit factor, max drawdown, and discipline score.
Monthly reviews catch execution problems. Quarterly reviews catch strategy-level problems.
Slice your data by day, session, pair, and setup grade to find hidden leaks.
One focused change per month beats five vague goals you forget by week two.
Why Most Traders Skip Reviews (And Pay for It)
You already know you should review your trades. So why does it not happen?
Three reasons, usually. First, the data is scattered. Your trades are in one spreadsheet, your plan is in a notebook, and your screenshots are in a random folder on your desktop. By the time you pull everything together, you have lost the motivation to actually analyze it.
Second, the process feels overwhelming. "Review your performance" sounds simple until you sit down and realize you have no framework. What do you look at first? What counts as a pattern versus noise? Without structure, most traders scroll through their trade journal for ten minutes, feel vaguely bad about their losses, and close the tab.
Third, the results are uncomfortable. A review might reveal that your favorite setup (the one you take six times a week) has a negative expectancy. Or that you break your rules every Friday afternoon. Or that your actual risk per trade is 3% when you told yourself it was 1%. Nobody enjoys that conversation with themselves.
But here is the reality: the traders who review consistently are the ones who improve. Everyone else is just repeating the same month on loop. Ever looked at your account three months later and wondered why nothing changed? This is why.
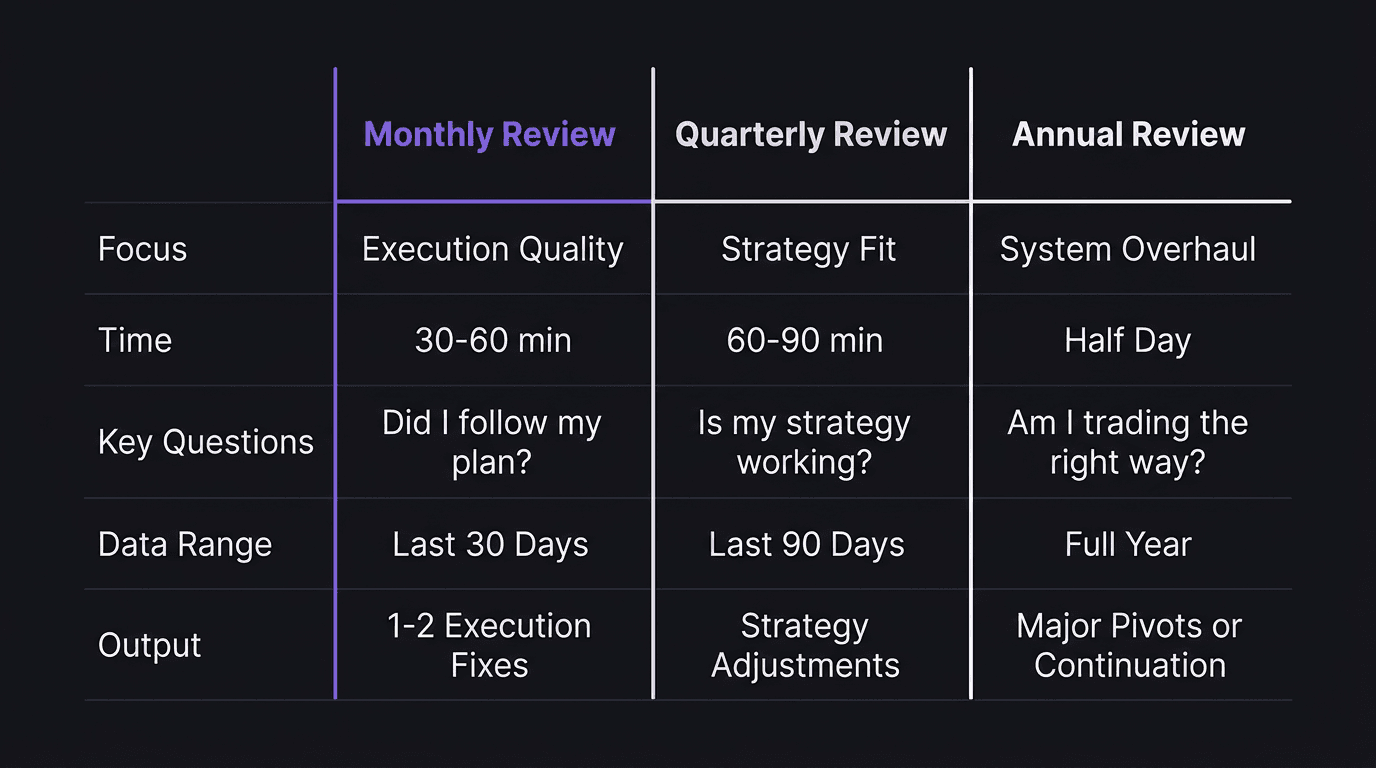
What to Review Monthly vs Quarterly vs Annually
Not every review covers the same ground. Trying to do everything every month leads to burnout and surface-level analysis.
Monthly Review (30 to 60 Minutes)
This is your core feedback loop. Pull the last 30 days of trades and focus on execution quality.
What to examine:
Overall metrics: win rate, average R, profit factor for the month
Plan compliance: how many trades followed every rule? Express it as a percentage.
Setup breakdown: win rate and average R for each setup type you trade (A+, B, C-grade)
Worst trades: pull the three biggest losses. What happened? Was the setup bad, or was the execution bad?
Best trades: pull the three biggest wins. Can you replicate the conditions?
The monthly review is about execution. Did you do what your plan says? If yes and you still lost money, the plan needs adjusting. If no, the plan is fine. Your discipline is the problem.
Quarterly Review (60 to 90 Minutes)
Zoom out. The quarterly review is about strategy, not execution.
What to examine:
Equity curve shape: trending up, flat, or declining? A flat curve with a good win rate means your R:R is off.
Pair performance: are you profitable on all the pairs you trade, or is one pair dragging down the others?
Session performance: which kill zones produce your best results? Which ones cost you money?
Goal progress: where are you relative to your annual and quarterly targets?
Rule changes: based on three months of data, which rules should you add, modify, or remove?
Annual Review (Half Day)
Once a year, step back and assess the whole system. Are you trading the right strategy for your personality? Is your risk model appropriate for your account size? Do your results justify the time you spend? This is where big pivots happen, like dropping a pair, changing your session, or overhauling your entry model entirely.
The Five Numbers That Tell You Everything
You do not need a wall of metrics. Five numbers, reviewed monthly, tell you whether your trading is improving, stagnating, or quietly falling apart.
1. Win Rate
The percentage of trades that hit target. Simple but insufficient on its own. A 40% win rate is excellent if your average winner is 3R. A 70% win rate is terrible if your average winner is 0.3R and your average loser is 1R.
Track it monthly to spot trends. A win rate that drops from 55% to 42% over two months is a signal. Something changed in your execution, your market conditions, or both.
2. Average R
How much you make per winning trade, measured in multiples of your risk. If you risk $100 and your average win is $220, your average R is 2.2R.
This number tells you how well you manage trades. A dropping average R often means you are cutting winners short (fear of giving back profit) or moving your stop too aggressively. If you struggle with this, the piece on trading fear covers the psychology behind it.
3. Profit Factor
Total gross profit divided by total gross loss. A profit factor of 1.0 means you broke even. Above 1.5 is solid. Above 2.0 is strong.
Why track this instead of just net PnL? Because profit factor is normalized. It tells you about the quality of your edge regardless of position sizing. You can have a great profit factor and still lose money if your sizing is off, and that distinction matters for knowing what to fix.
4. Max Drawdown
The largest peak-to-trough decline in your equity curve during the review period. This tells you about risk, not returns.
A trader with a 15% monthly return and a 25% max drawdown is on borrowed time. The returns look great until one bad streak wipes out three months of gains. Track drawdown alongside returns to get the full picture.
5. Discipline Score
This one is not in most tracking tools, so you calculate it yourself. Count the trades where you followed every rule in your plan. Divide by total trades.
> 38 trades followed plan / 45 total trades = 84% discipline score
Track this monthly. It is the single most honest metric in your dashboard. Everything else can be explained away by market conditions. Discipline score cannot.
How to Spot Patterns in Your Data
Raw numbers tell you the "what." Slicing the data tells you the "why."
Slice by Day of Week
Pull your win rate and profit factor for each day. You might discover that Mondays are your worst day (you trade aggressively to "start strong") or that Fridays bleed money (you force trades before the weekend). One trader in Brett Goh's program found that removing Monday trades from his dataset turned a 1.1 profit factor into a 1.8. Same strategy, same pair, same session. Just not on Mondays.
Slice by Session
If you trade forex, your results will look different across London, New York, and Asian sessions. Pull the numbers for each. A trader who is profitable in London but negative in New York is not bad at trading. They are trading the wrong session part of the time.
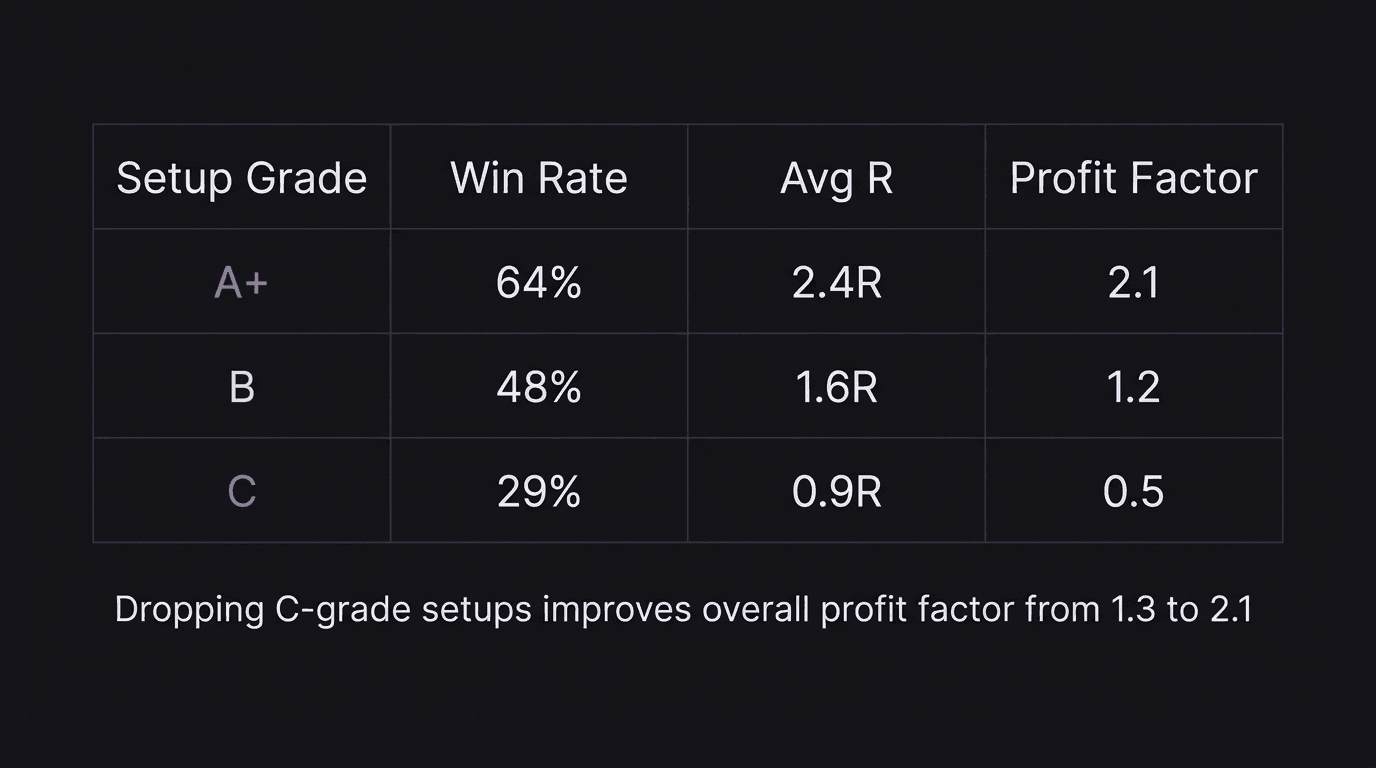
Slice by Setup Grade
This is where the uncomfortable truth lives. If your plan defines A+, B, and C-grade setups, pull the metrics for each category separately.
Most traders find something like this:
Setup Grade | Win Rate | Avg R | Profit Factor |
|---|---|---|---|
A+ | 64% | 2.4R | 2.1 |
B | 48% | 1.6R | 1.2 |
C | 29% | 0.9R | 0.5 |
The pattern is clear. A+ setups carry the account. C-grade setups drain it. But C-grade setups feel productive because you are "in a trade." That is the leak. Stop taking C-grade setups and your profit factor jumps without changing anything else about your strategy.
Slice by Emotional State
If your journal tracks how you felt before each trade (calm, anxious, frustrated, bored), slice by that too. Trades taken while bored or frustrated almost always underperform. This connects directly to the patterns covered in common trading mistakes and the discipline framework in your pre-market routine.
A Sample Monthly Review Walkthrough
Theory is fine. Here is what a real review looks like, step by step.
The Setup
A trader has been trading GBP/USD on the 15-minute chart during London session for four weeks. They follow a supply and demand strategy with liquidity sweep confirmation. Their plan defines three setup grades: A+ (all criteria met), B (most criteria met), and C (took the trade anyway).
They logged 42 trades in their journal and it is the last Sunday of the month.
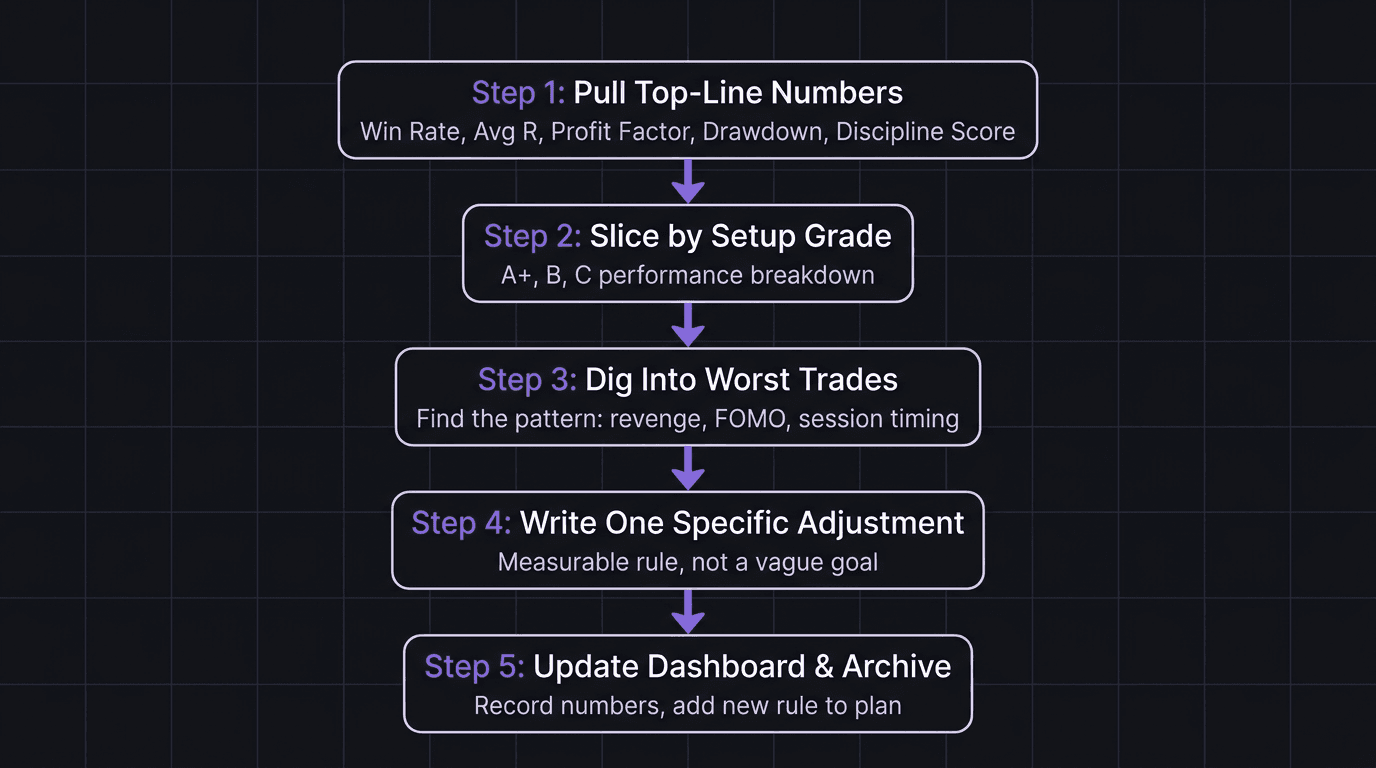
Step 1: Pull the Top-Line Numbers
Metric | Value |
|---|---|
Win rate | 50% (21 wins, 21 losses) |
Average R | 1.9R |
Profit factor | 1.4 |
Max drawdown | 4.2% |
Discipline score | 76% (32/42 trades followed plan) |
First reaction: profit factor is 1.4. Positive, but thin. One bad week could push it below 1.0. The discipline score at 76% means 10 trades broke at least one rule.
Step 2: Find the Leaks
Slice by setup grade:
A+ setups (18 trades): 67% win rate, 2.3R average, profit factor 2.4
B setups (14 trades): 43% win rate, 1.5R average, profit factor 1.1
C setups (10 trades): 30% win rate, 1.1R average, profit factor 0.6
There it is. The 10 C-grade trades are dragging the entire month down. Without them, the profit factor jumps from 1.4 to approximately 1.9.
Step 3: Dig Into the C-Grade Trades
Pull those 10 trades and look for the pattern:
6 of 10 happened after a loss (revenge entries)
3 happened during the last 30 minutes of London session (chasing before close)
1 was a genuine borderline call that could go either way
The leak is not the strategy. The leak is emotional trading after losses and time-pressure entries near session close.
Step 4: Write the Adjustment
> March adjustment: No new entries in the final 30 minutes of London session. After any loss, wait 15 minutes before the next trade. Review this rule in April's review.
One specific change. Measurable. Reviewable. Not "be more disciplined" or "only take A+ setups" (which they already know but are not doing).
> What NOT to do: A different trader runs the same review and sees similar C-grade leaks. Their adjustment note says "I need to be more patient and disciplined, focus on quality setups, and stick to my plan." That sounds productive. It changes nothing. There is no specific trigger, no measurable rule, no way to check compliance next month. Compare that to "no entries in the final 30 minutes" and you see why specific adjustments beat vague intentions.
Step 5: Update the Dashboard
Record the month's final numbers, archive the data, and add the new rule to the plan section. Next month's review starts by checking whether the adjustment worked.
How EdgeFlo Surfaces Review Data
The hardest part of a performance review is not the analysis. It is getting the data into a format you can actually analyze. That is where most spreadsheet-based systems fall apart after the first month.
EdgeFlo's journal has daily, weekly, and monthly overview with a calendar-style view. Instead of scrolling through rows of trade data, you see your month laid out visually. Green days, red days, the pattern jumps out before you start crunching numbers.
For Plus users, the Weekly AI Report summarizes what worked, what didn't, discipline issues, and one focus for the next week. That means you get a mini-review every seven days without doing the work yourself. The monthly review then builds on four weeks of already-summarized data instead of starting from raw entries.
The review process described in this article still applies. EdgeFlo does not replace your thinking. It removes the friction that stops most traders from sitting down and doing the review in the first place. When the data is already organized, sliced, and visualized, the 30-minute monthly review actually takes 30 minutes instead of two hours of spreadsheet wrestling.
The Edge Brief
Receive Insights on trading psychology, discipline, and the behavioral patterns that create consistent traders from our Founder and the EdgeFlo team, delivered to your inbox.
Think different. Trade different.
How often should I do a trading performance review?
What numbers should I track in a trading performance review?
What is a good profit factor for a trader?
How do I calculate my discipline score?

Turn discipline on.
Every session.
EdgeFlo is the environment serious traders operate inside.
Start 7-Day Trial — $7
Cancel anytime.
No long-term commitment.


Think Different, Trade Different.