

Trading Profit Factor: What It Is and What Yours Should Be
Profit factor measures how much you earn per dollar lost. Learn how to calculate it, what good looks like, and how it combines with win rate and avg R.

Profit factor is the ratio of your gross profits to your gross losses. A profit factor of 1.5 means you earn $1.50 for every $1.00 you lose. Below 1.0, you are losing money. Above 1.0, you are making money. The number itself tells you whether your edge is real or whether you are just getting lucky on a few big trades.
Most traders obsess over win rate. But win rate alone can lie to you. A trader with a 75% win rate can still be bleeding money if their losses are three times the size of their wins. Profit factor cuts through that noise because it weighs dollars, not just trade counts.
TL;DR
Profit factor = gross profit divided by gross loss. Above 1.0 means net positive. Below 1.0 means net negative.
A profit factor between 1.5 and 2.0 is solid for most active traders. Above 2.0 is strong.
Win rate alone can mislead you. Profit factor accounts for how much you win and lose, not just how often.
Combining profit factor with win rate and average R gives you the full performance picture.
Track profit factor over at least 50-100 trades before drawing conclusions.
What Profit Factor Tells You
Think of profit factor like a fuel efficiency rating. It does not tell you how fast you drive or how far you went. It tells you how much mileage you got per gallon of gas burned. In trading, it tells you how much money you kept per dollar you risked and lost.
A profit factor of exactly 1.0 means you broke even. Your gross profits matched your gross losses, dollar for dollar. After commissions and spreads, you actually lost money. So 1.0 is not the goal. It is the floor.
Here is what the numbers mean in practice:
Below 1.0: You are losing money. Your losses outweigh your gains. Something in your strategy or execution is broken.
1.0 to 1.3: Technically profitable, but barely. After commissions, slippage, and the occasional bad week, you are probably flat or slightly negative.
1.3 to 1.5: Getting somewhere. You have an edge, but it is thin. One bad streak and you could slip below breakeven.
1.5 to 2.0: Solid territory. This is where most consistently profitable traders live. You earn $1.50 to $2.00 for every dollar lost.
2.0 to 3.0: Strong performance. Your winners substantially outweigh your losers, either because you win often, win big, or both.
Above 3.0: Exceptional, but suspicious over large sample sizes. If you have 200+ trades with a 3.5 profit factor, you are elite. If you have 12 trades, you just got lucky.
That last point matters. Profit factor is only meaningful with enough data. Ten trades can produce a profit factor of 5.0 from one outlier winner. Two hundred trades give you something worth trusting.
Ever looked at your monthly numbers and thought you had a good month, only to realize one big trade carried the entire thing? Profit factor across a full sample exposes that pattern. It forces you to look at the whole book, not just the highlights.
How to Calculate Profit Factor
The formula is dead simple:
Profit Factor = Gross Profit / Gross Loss
Gross profit is the total dollar amount from all your winning trades. Gross loss is the total dollar amount from all your losing trades (as a positive number, not negative). Divide the first by the second.
Walkthrough: A Month of GBP/USD Day Trades
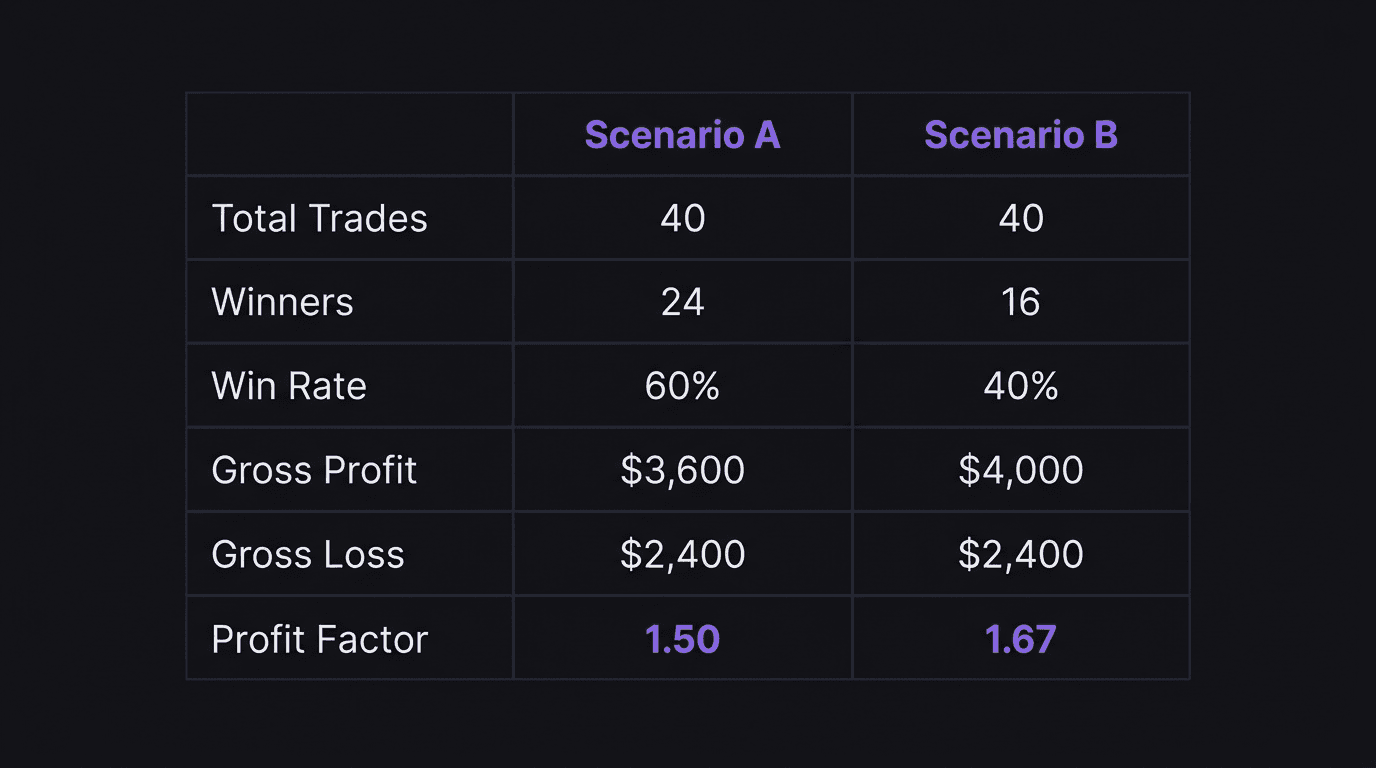
Say you traded GBP/USD during the London session for a full month. You took 40 trades total.
24 winners totaling $3,600 in gross profit
16 losers totaling $2,400 in gross loss
Profit factor = $3,600 / $2,400 = 1.50
That is a clean, workable edge. You earned $1.50 for every dollar you lost. Your win rate was 60% (24 out of 40), and the average winner ($150) was the same size as the average loser ($150). So in this case, the profit factor came entirely from winning more often, not from winning bigger.
Now change the scenario. Same 40 trades, but different sizing:
16 winners totaling $4,000 in gross profit (average win: $250)
24 losers totaling $2,400 in gross loss (average loss: $100)
Profit factor = $4,000 / $2,400 = 1.67
This time your win rate was only 40%, but your average winner was 2.5 times your average loss. The profit factor is actually higher than the first scenario. This is why profit factor matters more than win rate in isolation. It captures both frequency and magnitude.
Walkthrough: How a Good Win Rate Hides Bad Performance
Here is the mistake scenario. A trader runs a scalping strategy on EUR/USD. Over 60 trades in two weeks:
45 winners totaling $1,350 (average win: $30)
15 losers totaling $1,800 (average loss: $120)
Win rate: 75%. Looks fantastic on paper. But profit factor = $1,350 / $1,800 = 0.75
This trader is losing money. Every $1 they lose costs them $1.33 to earn back. The 75% win rate is a trap. Their losers are four times the size of their winners, and no win rate can overcome that imbalance at these ratios.
Sound familiar? Plenty of traders fall into this. They cut winners early and let losers run. The win rate stays high because they are banking small wins constantly. But a few large losses wipe out weeks of progress. Profit factor catches this immediately. Win rate does not.
What Counts as a Good Profit Factor
There is no single magic number, but there are ranges that experienced traders use as benchmarks. The right target depends on your strategy type, your risk per trade, and how many trades you take.
Scalping and high-frequency strategies tend to run profit factors between 1.2 and 1.5. The edge is thin but consistent. High volume makes up for low margin per trade.
Swing trading and position trading can sustain higher profit factors, often 1.5 to 2.5, because each trade has more room to run and the trader is selective about entries.
Day trading sits in the middle. A profit factor between 1.3 and 2.0 across 100+ trades is realistic and strong.
Here is the thing most articles miss: a "good" profit factor depends on where it comes from. A 1.8 profit factor built on 200 trades with controlled risk is far more reliable than a 2.5 profit factor built on 30 trades where one outlier inflated the numbers.
That is why you need to pair profit factor with sample size. Brad from 1% Club talks about this when he says the work needs to be done and reviewed. You cannot draw conclusions from a handful of trades. You need enough reps to see whether the number holds up under different market conditions, different sessions, and different emotional states.
If your profit factor sits below 1.0 after 100+ trades, something structural is wrong. Either your entries are bad, your trade management is leaking money, or your position sizing is off. That is not a motivation problem. It is a process problem.
Profit Factor vs Win Rate: Which Matters More
Neither one wins in isolation. But if you had to pick only one number to evaluate a strategy, profit factor gives you more information.
Win rate tells you how often you are right. That is it. A trader with a 90% win rate who loses $10 on every loss and makes $1 on every win has a profit factor of 0.9. They are net negative despite being "right" nine out of ten times.
Profit factor tells you the dollar efficiency of your trading. It captures both how often you win and how much you win relative to how much you lose. But it still has blind spots.
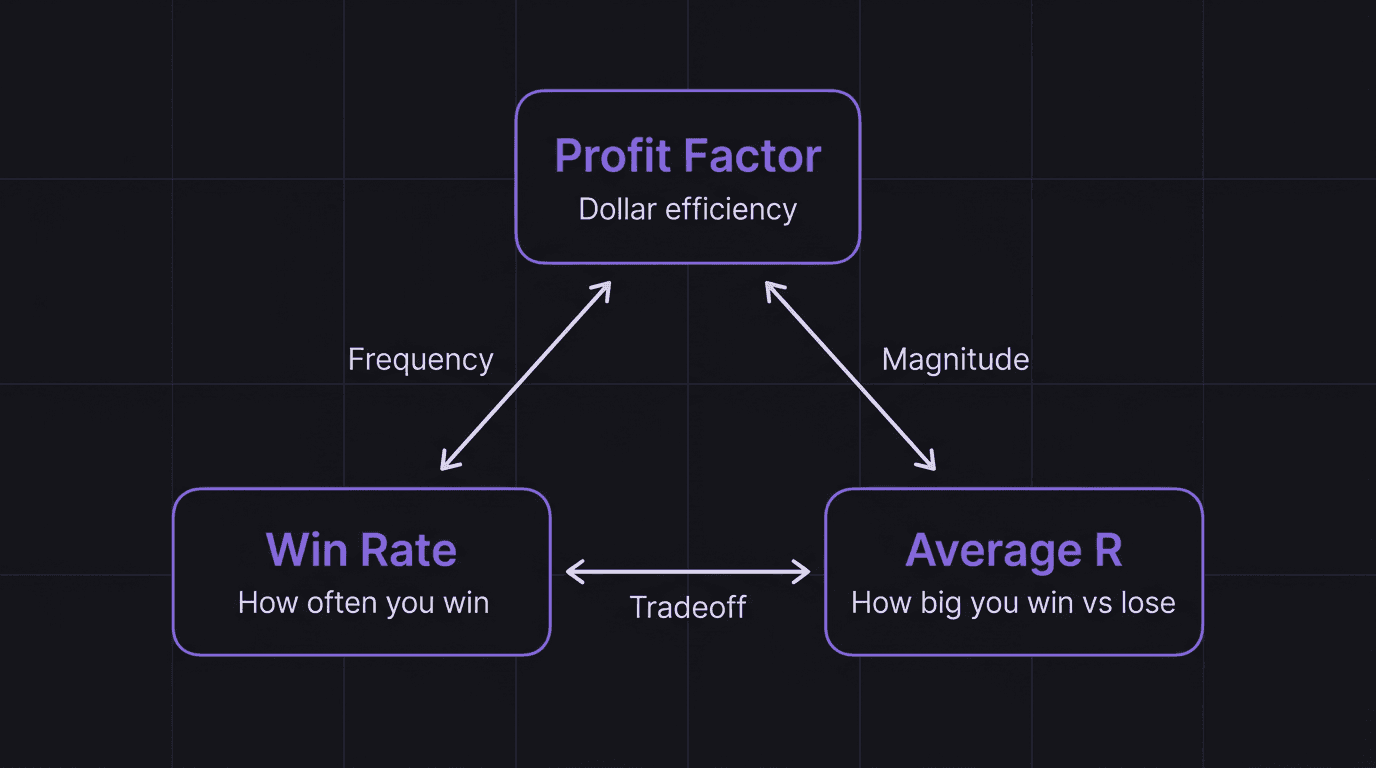
Here is where it gets practical. The three metrics that give you the complete picture are:
Win rate: how often you are right
Average R: how big your average winner is relative to your average loser (also called risk-to-reward ratio on individual trades)
Profit factor: the dollar-weighted summary of the first two
These three are mathematically linked. If you know any two, you can derive the third. Your trading expectancy is essentially what profit factor measures in dollar terms per trade.
Here is the relationship: a trader with a 50% win rate needs an average R of at least 1.0 to break even (profit factor = 1.0). Bump average R to 1.5 with the same 50% win rate, and profit factor jumps to 1.5. Now drop win rate to 40% but push average R to 2.0: profit factor = (0.40 x 2.0) / (0.60 x 1.0) = 1.33.
The math forces a tradeoff. Lower win rates demand higher average R. Higher win rates can survive lower average R. Profit factor is the scoreboard that tells you whether your combination works.
When you review your equity curve, you can see profit factor in action. A smooth upward curve suggests a stable profit factor above 1.0 across time. A jagged curve with long drawdowns followed by spike recoveries suggests your profit factor depends on occasional large wins, which is a fragile setup.
Track all three numbers in your trading journal. Not just after a good week. Every week. The pattern across months matters more than any single snapshot.
How EdgeFlo Shows Your Profit Factor
EdgeFlo's Trading Dashboard puts profit factor front and center alongside win rate and average R. You do not have to export trades to a spreadsheet or manually calculate gross profit and gross loss. The dashboard pulls from your journal automatically and updates as you log trades.
The value is context. Seeing profit factor next to win rate and average R in one view makes it obvious when the numbers tell different stories. A week where your win rate drops but your profit factor holds steady means your trade selection got better even if you lost more often. A week where win rate climbs but profit factor drops means you are probably cutting winners short.
Having all three metrics visible in one place removes the temptation to cherry-pick the number that makes you feel best. The dashboard gives you the honest picture every time you sit down to review your performance.
The Edge Brief
Receive Insights on trading psychology, discipline, and the behavioral patterns that create consistent traders from our Founder and the EdgeFlo team, delivered to your inbox.
Think different. Trade different.
What is a good profit factor for day trading?
Can you have a high win rate but a low profit factor?
How many trades do I need before profit factor is reliable?
Is profit factor better than win rate for measuring performance?

Turn discipline on.
Every session.
EdgeFlo is the environment serious traders operate inside.
Start 7-Day Trial — $7
Cancel anytime.
No long-term commitment.


Think Different, Trade Different.