

Trading Progress Tracker: Are You Getting Better?
A trading progress tracker measures improvement over weeks and months, not just daily P&L. Track these signals to know if you are getting better.

A trading progress tracker tells you whether your execution and decision-making are improving over weeks and months, not just whether today was green or red. Most traders check their P&L after every session and call that "tracking." It is not. Real progress shows up in your process consistency, your average risk-to-reward, and how often you follow your own rules. Daily P&L hides all of that behind noise.
If you have ever had a great week followed by a terrible week and felt like you are going in circles, the problem is almost certainly your measurement, not your strategy. You need a system that captures the signals that actually predict long-term growth.
TL;DR
Daily P&L is a terrible measure of improvement because it mixes skill with randomness.
Five specific signals (win rate trend, average R, profit factor, rule adherence, and fewer revenge trades) reveal whether you are actually getting better.
A simple tracker with four columns is enough to start measuring real progress.
Compare month 1 to month 3 using those signals, not just total dollars made.
Consistent process, tracked and reviewed, is the only path to consistent results.
Why Daily P&L Hides Your Real Progress
You finish a session up $200 and feel like a genius. Next day you give it all back and feel like quitting. Sound familiar?
This is the cycle most traders get stuck in: win, get overconfident, take stupid trades, lose, doubt your strategy, get scared, miss good setups, then revenge trade to make it back. Each day feels like a verdict on your ability. But one day's P&L tells you almost nothing about whether you are improving as a trader.
Here is why. A single trade can go your way for the wrong reasons. You entered off-plan, ignored your stop, and price happened to bounce. Green day. Your P&L says "good job." Your process says "you got lucky." If you only look at the dollar number, you cannot tell the difference.
Real progress hides underneath the noise. It lives in questions like: Did you follow your plan more often this week than last week? Is your average winner getting larger relative to your average loser? Are you taking fewer impulsive trades than you were 30 days ago?
Those questions require data collected over time, not a quick glance at your account balance. That is what a trading progress tracker actually does. It separates the signal from the daily noise so you can see the trend in your execution quality.
Five Signals You Are Improving
Forget about how much money you made last week. These five signals tell you whether your trading is actually getting better.
1. Win Rate Trend (Not Absolute Win Rate)
A 40% win rate is not bad. A 40% win rate that was 35% two months ago is progress. What matters is the direction, not the number. Track your win rate in rolling 20-trade blocks and watch whether the line slopes up, even slightly.
2. Average R Per Trade
Your average R per trade measures how much you make on winners relative to how much you lose on losers, normalized to your risk unit. If your average R is climbing from 0.3 to 0.5 to 0.7 over three months, your trade selection and management are improving. This is one of the most honest numbers in your entire tracker.
3. Profit Factor Over Time
Profit factor is total gross profit divided by total gross loss. A profit factor of 1.0 means you are breaking even. Above 1.0, you are net positive. Track it monthly. If your profit factor is rising, your overall edge is growing, even if individual weeks feel flat.
4. Rule Adherence Rate
This one is pure process. After each trade, ask yourself: did I follow my plan? Yes or no. No gray area. Track the percentage of trades where you answered "yes" over each 20-trade block. This is the signal the transcript keeps hammering: consistent action leads to consistent results. If your rule adherence goes from 60% to 80%, your results will follow, even if there is a lag.
5. Fewer Revenge and Impulse Trades
Count the number of trades each week that you took outside your plan. Maybe you entered because you were angry about a loss. Maybe you chased a move because you felt left out. Track that number. If it drops from 5 per week to 2 per week to 1, that is measurable improvement in discipline. That is the kind of progress that compounds.
How to Build a Simple Progress Tracker
You do not need expensive software to start. A spreadsheet with four columns works.
Column 1: Date and pair. Just the basics. When did you trade, and what did you trade?
Column 2: R result. Not dollars. Record the trade result in R multiples. A 2R winner means you made twice your risk. A -1R loser means you lost exactly what you risked. This normalizes everything so you can compare trades across different position sizes.
Column 3: Followed plan? (Yes/No). Binary. No "kind of." You either followed your entry criteria, your stop placement, and your exit rules, or you did not. This column alone will show you patterns you cannot see any other way.
Column 4: Notes. One sentence. What was the setup? What did you feel? Was there anything unusual? Keep it short. You are building data, not writing a diary.
That is it. Four columns. Fill them in after every trade. At the end of each week, calculate your win rate, average R, and rule adherence percentage for that block. At the end of each month, compare those numbers to the previous month.
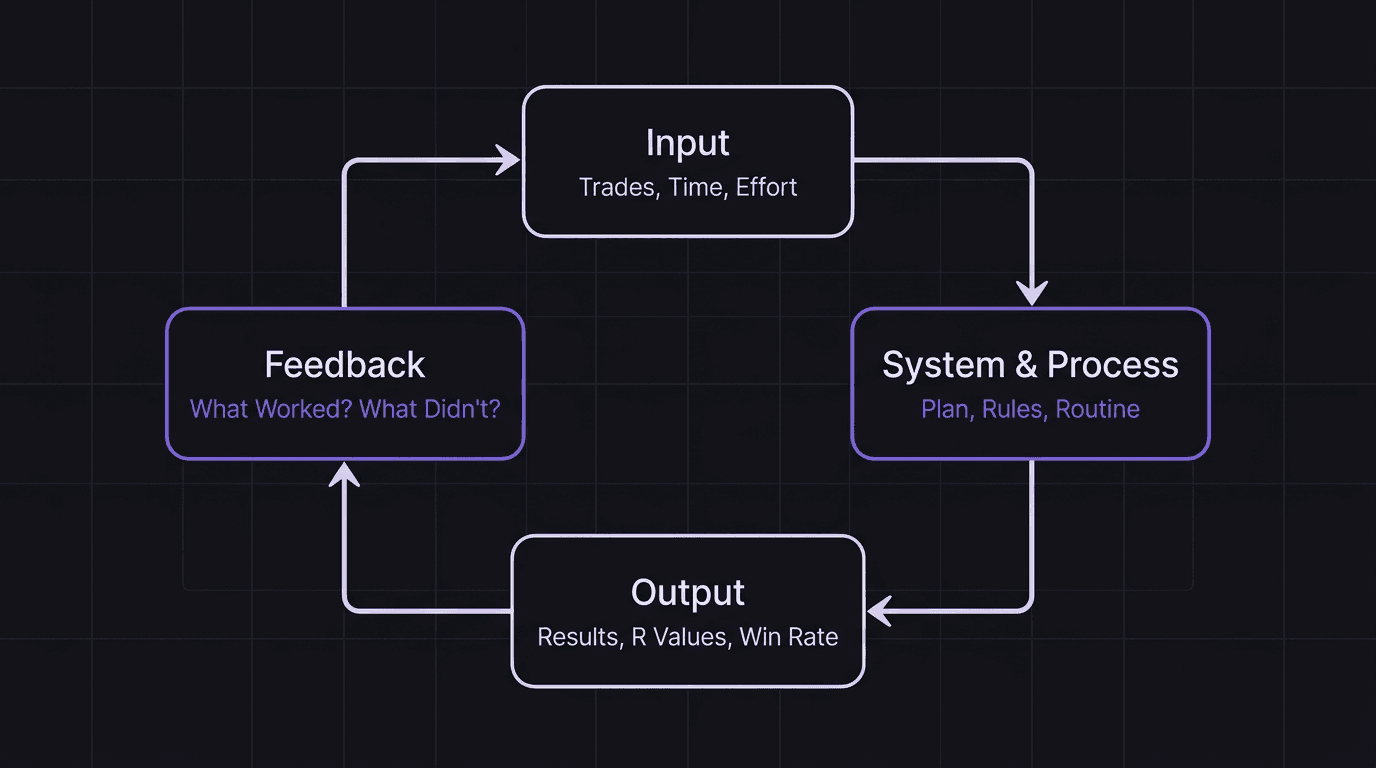
This is the feedback loop in action: input (your trades and effort), process (your system and review), output (your results), and then feedback that tells you what to work on next. Your tracker is the tool that makes that feedback loop visible.
If you want to go beyond a spreadsheet, a proper trading dashboard calculates these metrics automatically and shows trends over time. But start simple. The habit of tracking matters more than the tool.
Walkthrough: Comparing Month 1 vs Month 3
Here is what this looks like in practice. Say you are a beginner swing trader working GBP/USD on the 4-hour chart with a 2% risk per trade.
Month 1 (First 25 Trades)
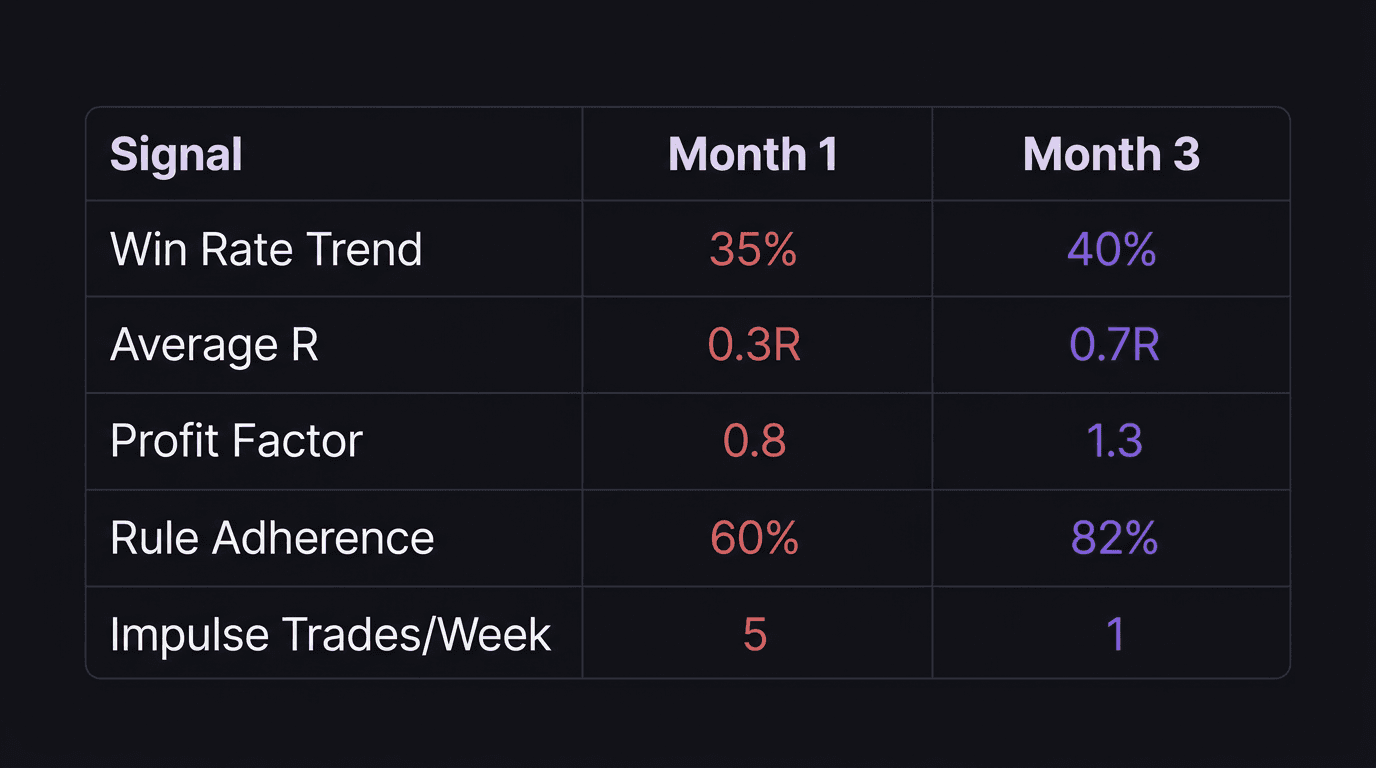
You take 25 trades. 8 winners, 17 losers. Win rate: 32%. Your average winner is 1.8R and your average loser is -1.0R. Profit factor: (8 x 1.8) / (17 x 1.0) = 14.4 / 17.0 = 0.85. You are slightly negative.
You followed your plan on 15 out of 25 trades. Rule adherence: 60%. You count 6 trades that were clearly revenge or impulse entries. Your journal notes say things like "entered because I was angry about the last loss" and "chased the breakout without waiting for a pullback."
That is your baseline. Not great, but now you can see it.
Month 3 (Trades 51 to 75)
You take another 25-trade block. 11 winners, 14 losers. Win rate: 44%. Average winner: 2.1R. Average loser: -1.0R (you kept your losses consistent). Profit factor: (11 x 2.1) / (14 x 1.0) = 23.1 / 14.0 = 1.65. You are solidly profitable in this block.
Rule adherence: 21 out of 25 trades followed the plan. That is 84%. Impulse trades dropped to 1 for the entire month.
What Changed?
You did not find a better strategy. You did not switch pairs or timeframes. You executed the same plan with more consistency. Your win rate climbed 12 percentage points. Your average R improved by 0.3R. Your profit factor went from below breakeven to 1.65. And the biggest shift was rule adherence, jumping from 60% to 84%.
This is what "do more of what works and less of what doesn't" looks like in practice. The tracker made it obvious what "what works" actually was: following the plan. Without the tracker, month 1 and month 3 might have felt the same (some wins, some losses, emotional ups and downs). With the tracker, the improvement is undeniable.
When Progress Stalls (And What to Change)
Sometimes the numbers stop moving. You have been tracking for two months, your win rate is flat, your average R is flat, and your rule adherence has plateaued around 70%. Now what?
Check Your Inputs First
If your output is stagnant, look at your input. Are you actually reviewing your journal each week? Or are you logging trades and never looking at them again? A tracker only works if you close the feedback loop. Logging without reviewing is like journaling into a void.
Isolate One Variable
Do not try to fix everything at once. Pick the weakest signal from your five metrics. If rule adherence is your lowest number, spend the next 20 trades focused only on following the plan, even if it means taking fewer trades. If average R is low, review your last 10 winners and ask whether you exited too early.
Compare Losing Trades to Winning Trades
Pull up your last 10 losses and your last 10 wins. What was different? Did losses happen on specific pairs, sessions, or after a certain number of trades in a day? Your monthly trading stats will reveal whether the problem is the setup, the execution, or the conditions.
Give It Enough Data
Twenty trades is the minimum for a meaningful sample. Fifty is better. If you are a swing trader taking 5 to 8 trades per month, you need at least three months before the data tells you anything reliable. Do not panic-change your system after 10 trades. The transcript warns about exactly this: doubting your strategy too early, switching to something else, and restarting the cycle.
Build a Review Routine
Routine is a core part of this process. Set a weekly 15-minute review where you look at your tracker, calculate the five signals, and write one sentence about what to focus on next week. That one sentence is your feedback loop in action. A trading habit tracker can help you stay consistent with the review itself.
How EdgeFlo Tracks Your Progress Automatically
Everything above works with a spreadsheet. But if you want the math done for you, EdgeFlo's trading dashboard calculates win rate, average R, and profit factor automatically from your journal entries. You do not have to build formulas or remember to update a sheet.
EdgeScore measures your execution quality over time, not just your P&L. It looks at whether you followed your plan, managed risk properly, and avoided impulsive entries. That single number trending upward tells you your process is improving, even during drawdowns. Your trading performance review shows these trends across weeks and months so you can compare blocks the same way the walkthrough above does.
The weekly AI report (Plus plan only) highlights specific improvement areas based on your recent trades. Instead of staring at raw numbers and guessing what to work on next, the report tells you where your feedback loop should focus. It closes the gap between tracking data and actually using it.
The Edge Brief
Receive Insights on trading psychology, discipline, and the behavioral patterns that create consistent traders from our Founder and the EdgeFlo team, delivered to your inbox.
Think different. Trade different.
What should a trading progress tracker include?
How often should I review my trading progress?
Can I track trading progress with a spreadsheet?
How long before I see measurable improvement?

Turn discipline on.
Every session.
EdgeFlo is the environment serious traders operate inside.
Start 7-Day Trial — $7
Cancel anytime.
No long-term commitment.


Think Different, Trade Different.