

Session Performance Tracking: Find Your Best Trading Window
Track your win rate and R-multiples by trading session to find your best window. Stop forcing trades in sessions that cost you money.

You trade the same strategy every day, but some days it prints money and other days it bleeds. The strategy did not change. The pair did not change. So what changed?
In many cases, the session changed.
A trader who is profitable during London session but negative during Asian session has a session problem, not a strategy problem. But most traders never measure this. They look at overall win rate, overall expectancy, overall equity curve. Those aggregate numbers hide the fact that one session is carrying the other, and the weak session is dragging total performance down.
Tracking your results by session is one of the simplest ways to improve your trading without changing anything about your analysis or entries. You just stop trading during the windows where you lose.
TL;DR
Your results vary by session because each session has different volume, volatility, and pair behavior.
Tracking win rate and R-multiples by session reveals which window actually pays you.
Most traders find one session significantly outperforms the others over 50+ trades.
Cutting your weakest session can improve total performance without changing your strategy.
Session data also reveals whether your emotional state or the market conditions are the problem.
Why Your Results Vary by Session
Each forex kill zone has its own personality. That personality affects how your strategy performs, even if your rules stay identical.
Asian session (roughly 00:00 to 08:00 GMT): Low volume, tight ranges. Pairs like GBP/USD and EUR/USD often move 20 to 40 pips total during this window. Strategies that need momentum struggle here. Strategies that fade extremes and trade reversals within a range can work, but the reward per trade is smaller.
London session (roughly 08:00 to 16:00 GMT): The highest-volume session. This is where the majority of forex volume flows. Pairs move with purpose. Trends establish themselves. Breakouts from Asian session ranges often happen in the first two hours of London. If your strategy needs clean directional moves, London is usually where you find them.
New York session (roughly 13:00 to 21:00 GMT): Overlaps with London for the first three hours, creating the highest-volatility window of the day. After London closes, New York can get choppy. The first two hours of New York often produce strong moves, but the last two hours can give back gains through whipsaws.
Your strategy interacts differently with each of these environments. A pullback strategy that works beautifully during London trends might get chopped up in Asian ranges. A mean-reversion strategy that profits from Asian consolidation might get steamrolled by London breakouts.
The only way to know is to measure.
The Three Sessions and Their Personality
Think of sessions the way you think about weather patterns. You would not wear the same outfit to a desert and a rainforest. Similarly, you should not trade the same way (or trade at all) in sessions that do not match your strategy's requirements.
Asian session personality: Quiet, range-bound, patience-testing. JPY pairs (USD/JPY, EUR/JPY) tend to move more than European pairs during this window. If you are based in Australia, Southeast Asia, or the Pacific, this is your local session. The challenge is that setups form slowly and the payoff per trade is often smaller.
London session personality: Directional, liquid, decisive. GBP pairs and EUR pairs wake up here. The London open often sweeps Asian session highs or lows before establishing the day's trend. This is where most retail forex traders find their edge, because the moves are clean enough to catch and large enough to pay.
New York session personality: Volatile, news-driven, two-phased. The overlap with London (13:00 to 16:00 GMT) produces the day's largest moves. After London closes, New York can become erratic. USD pairs drive this session. Economic data releases from the US create spikes that can hit your stop or your target in seconds.
Tracking Win Rate and R by Session
Here is how to set up session tracking that produces actionable data.
Step 1: Tag every trade with the session it was entered in. Not the session it closed in (a trade entered during London that closes during New York is a London trade).
Step 2: After 30+ trades per session, calculate three metrics: win rate, average R-multiple (winners), and expectancy.
Step 3: Compare. The differences might surprise you.
Walkthrough: Three Months of Session Data
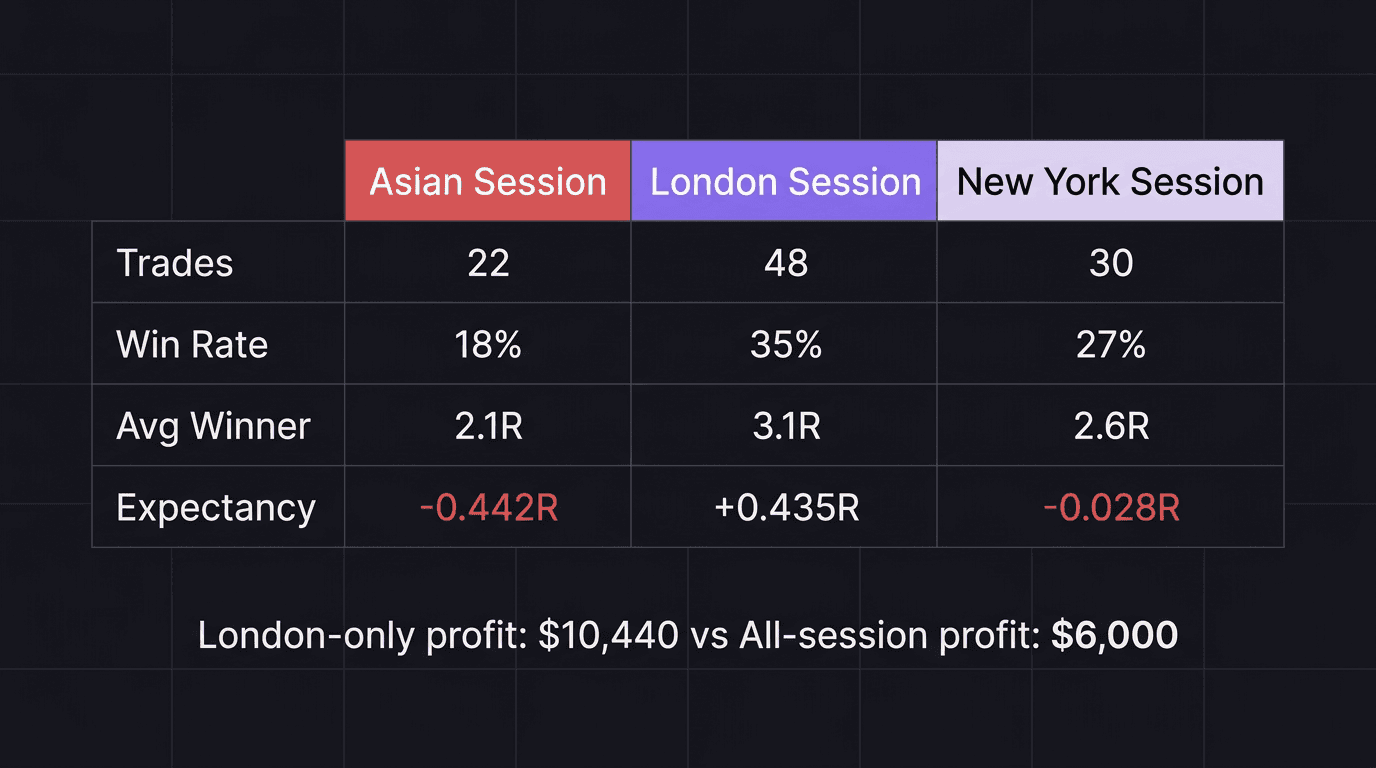
Trader: Trades GBP/USD with a pullback strategy. Risk: 1% per trade. $50,000 account ($500 risk per trade). Target: 3R. Three months of data.
Asian session (22 trades): - Win rate: 18% (4 wins, 18 losses) - Average winner: 2.1R - Expectancy: (0.18 x 2.1R) minus (0.82 x 1R) = 0.378R minus 0.82R = negative 0.442R per trade
Math check: - 0.18 x 2.1 = 0.378. - 0.82 x 1 = 0.82. - 0.378 minus 0.82 = negative 0.442.
London session (48 trades): - Win rate: 35% (17 wins, 31 losses) - Average winner: 3.1R - Expectancy: (0.35 x 3.1R) minus (0.65 x 1R) = 1.085R minus 0.65R = positive 0.435R per trade
Math check: - 0.35 x 3.1 = 1.085. - 0.65 x 1 = 0.65. - 1.085 minus 0.65 = 0.435.
New York session (30 trades): - Win rate: 27% (8 wins, 22 losses) - Average winner: 2.6R - Expectancy: (0.27 x 2.6R) minus (0.73 x 1R) = 0.702R minus 0.73R = negative 0.028R per trade
Math check: - 0.27 x 2.6 = 0.702. - 0.73 x 1 = 0.73. - 0.702 minus 0.73 = negative 0.028.
Overall (100 trades): Blended expectancy = positive 0.11R per trade. Barely profitable.
If this trader cut Asian and New York sessions: - London only (48 trades): Expectancy = positive 0.435R per trade. Profit over those 48 trades: 48 x 0.435 x $500 = $10,440.
Math check: - 48 x 0.435 = 20.88. - 20.88 x $500 = $10,440.
Versus keeping all sessions: - All 100 trades: 100 x 0.11 x $500 = $5,500.
Math check: - 100 x 0.11 = 11. - 11 x $500 = $5,500.
Fewer trades. Higher profit. Less screen time. Less emotional wear. That is the power of session filtering.
When Your Data Says Stop Trading a Session
The hardest part of session tracking is not collecting the data. It is acting on it.
After 50+ trades in a session with negative expectancy, the data is clear: that session costs you money. But traders resist cutting it because it feels like giving up opportunity. "What if I miss a big move during Asian session?" Well, what if the 18 losses you took during Asian session wiped out 8 of your London wins?
Here is the rule: if a session shows negative expectancy after 50 trades, cut it for 30 days. Trade only your best session for one month. Then compare your equity curve from that month to the previous three months.
Almost every trader who runs this experiment sees their curve smooth out. Fewer trades, but fewer drawdowns. Less screen time, but higher confidence. The trade frequency drops, but the quality per trade rises because you are only operating in your strongest environment.
This does not mean the other sessions are bad. It means your strategy, your psychology, and your schedule do not align with those sessions. Someone else might thrive in Asian session ranges. But your data tells you where your edge lives, not where edges exist in general.
One-session trading is not a limitation. It is a competitive advantage. You learn the rhythm of one window so deeply that you start anticipating moves before they unfold. That kind of intuition only develops through focused repetition, and session tracking is how you identify which window deserves that focus.
How EdgeFlo Breaks Down Your Session Stats
EdgeFlo's trading dashboard filters performance by session window automatically. Tag your trades by session (or let auto-import handle it), and the dashboard separates your metrics into the time blocks that matter.
You can see your win rate, average R, expectancy, and equity curve for each session independently. The trading performance review becomes session-aware, so your monthly review answers the question that matters most: "Which session should I trade next month?"
When the data shows London at +0.435R and Asian at negative 0.442R, the dashboard makes the decision obvious. You do not need willpower to avoid Asian session trades. You need visibility. And once you see the numbers, the right choice becomes the easy one.
What are the three main forex trading sessions?
How many trades do I need per session before the data is reliable?
Should I stop trading a session where I lose money?
Does session performance tracking work for stock traders?

Turn discipline on.
Every session.
EdgeFlo is the environment serious traders operate inside.
Start 7-Day Trial — $7
Cancel anytime.
No long-term commitment.


Think Different, Trade Different.