

Trade Frequency: Why Fewer Trades Pay More
More trades does not mean more profit. See how 5 trades produced $58K while overtrading produces losses, and how to track frequency in your dashboard.

Most traders believe that more trades equal more opportunities. More opportunities should mean more profit. The math seems obvious.
But the math is wrong.
A trader took five trades in an entire month. He lost three and won two, giving him a 40% win rate. Those two winners produced $58,000 in gross profit. After subtracting the three losses ($30,000) and accounting for fees, he ended the month at roughly $27,000 net positive.
Five trades. One month. Positive.
Now compare that to the first week of that same month, when he was trading with urgency and taking whatever looked "close enough." Three trades in five days, all losers, all forced. That high-frequency approach produced nothing but drawdown.
The relationship between trade frequency and profitability is not linear. More trades do not mean more money. In most cases, more trades mean more noise, more emotional decisions, and more exposure to setups that do not meet your criteria.
TL;DR
A real month: 5 trades, 40% win rate, +1.5R total, $58,000 in gross profit, $27,000 net after losses and fees.
The first week (3 forced trades) lost $30,000. The next three weeks (2 patient trades) made $58,000.
Overtrading inflates your trade count without improving your edge.
Track trade frequency alongside win rate and average R in your dashboard to find your optimal range.
Reducing frequency forces you to be selective, which improves every other metric.
The Myth of More Trades
The idea that more trades equal more profit only holds if every trade has a positive edge. In reality, most extra trades are filler: setups that almost meet your criteria, entries taken out of boredom, or revenge trades after a loss.
Every filler trade has a few costs beyond the potential loss itself:
Commission and spread costs. Even if a trade breaks even on price, you still pay the spread and any commissions. Over 50 trades per month, those costs accumulate into a real drag on your equity.
Emotional cost. Each trade occupies mental bandwidth. Managing five open positions is five times the stress of managing one. That stress degrades your decision-making on the trades that actually matter.
Data pollution. When you review your performance, filler trades obscure the signal from your high-quality setups. Your trading expectancy looks worse because it includes trades that never should have been taken.
The trader who made $58,000 on five trades could have easily taken 15 or 20 trades that month. The setups were there (sort of). But after losing $30,000 in the first week, he made a deliberate choice to reduce frequency and only execute on A+ setups that checked every box.
That choice was the most profitable decision he made all month.
5 Trades, $58K: A Real Month Breakdown
Walkthrough: June, GBP/JPY and Other Pairs
Here is how five trades across one month produced $58,000 in gross profit with a 40% win rate.
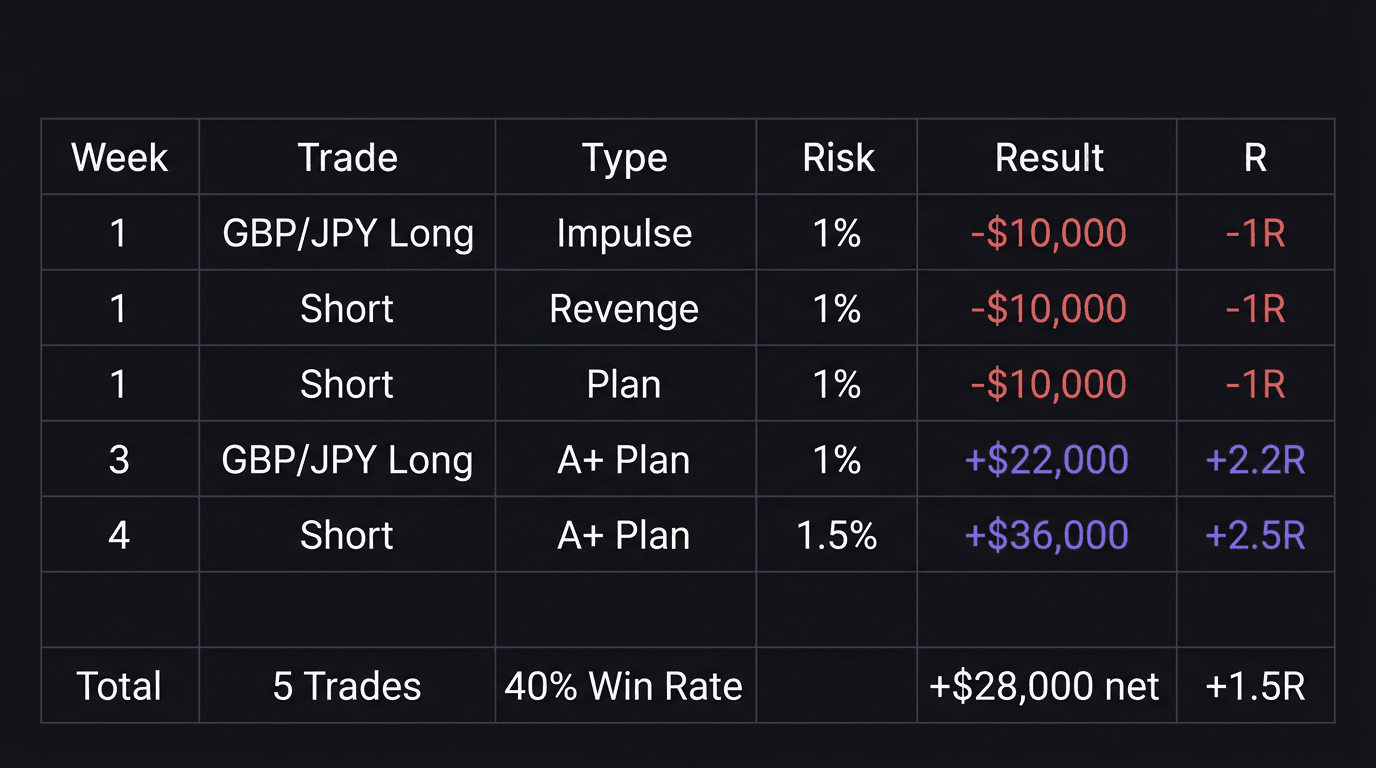
Week 1: Three trades, three losses, -$30,000
Trade 1: Entered long on GBP/JPY before the liquidity sweep confirmed. Impulse entry. Lost $10,000.
Trade 2: Entered short on a supply zone but ignored a bullish market shift on the lower timeframe. Ego and revenge after the first loss. Lost $10,000.
Trade 3: Followed the plan. Entry model confirmed, but the market was choppy. Variance loss. Lost $10,000.
Each trade risked approximately 1% of capital ($10,000 risk per trade on a six-figure account).
Week 2: Zero trades
Seven days off. Journal review. Rule revision. No entries.
Week 3: One trade, one win, +$22,000
Entered long on GBP/JPY after the 4-hour structure confirmed bullish, the medium timeframe showed higher highs and higher lows, and the liquidity sweep below the key low completed. The entry model confirmed with a fractal market shift. Risk: 1% ($10,000). Reward captured: approximately 2.2R ($22,000).
Week 4: One trade, one win, +$36,000
Entered short after price mitigated a supply zone that had swept previous highs and led to a break of structure to the downside. Waited for equal highs to be swept before entering on the liquidation candle. Risk: 1.5% on this trade because of the high-confluence A+ setup. Closed manually at approximately 2.5R ($36,000) because market conditions were slow and holding overnight carried unnecessary risk.
Month totals: 5 trades, 2 wins (40% win rate), approximately 1.5R net, $58,000 gross profit, roughly $27,000 net after losses, fees, and slippage.
The key number is not the dollar amount. It is the trade count. Five entries in 30 days. That is roughly one trade per week.
Track Frequency in Your Dashboard
You cannot manage what you do not measure. Most traders track win rate and P&L but never look at trade count as a performance variable.
Add these three frequency metrics to your trading dashboard:
1. Trades per week (rolling average)
Plot this alongside your equity curve. In most cases, you will see an inverse relationship: weeks with high trade counts show flat or negative equity, while weeks with low trade counts show gains.
If you track this on your equity curve, the pattern becomes visual. The peaks in your equity tend to come from low-frequency periods. The dips come from high-frequency stretches.
2. Win rate by frequency bracket
Split your trades into two groups: weeks where you took 1 to 3 trades and weeks where you took 4 or more. Compare the win rate for each group.
If your win rate drops significantly in the high-frequency bracket, that is concrete evidence that you are taking lower-quality setups when you trade more often.
3. Average R by frequency bracket
Same split. If your average R is higher in low-frequency weeks, your patient entries are producing better risk-to-reward ratios.
These three metrics together tell you your optimal trade frequency. Not a generic rule from the internet, but a data-driven number from your own results.
Run a performance review monthly to check whether your frequency is staying within the optimal range. If it drifts upward, investigate what is causing the extra trades (boredom, revenge, FOMO) and address the root cause.
How to Reduce Trades Without Reducing Profit
Cutting your trade count feels risky. If you take fewer trades, you might miss winners. But the data consistently shows the opposite: reducing frequency forces you to be more selective, which improves the average quality of every trade you take.
Here is how to do it without feeling like you are missing out:
Set a weekly trade cap. Start with a maximum of 2 to 3 trades per week. If you take two trades by Wednesday and both are losers, you are done until Monday. This forces you to be extremely selective with your first two entries.
Grade every setup before entry. Use a simple A/B/C grading system. A+ setups check every box in your plan. B setups check most boxes but are missing one element (maybe the higher timeframe is neutral instead of aligned). C setups look like they might work but you cannot fully articulate why.
Only take A+ setups. If that means zero trades this week, that is the correct result.
Track opportunity cost both ways. When you skip a trade that would have won, write it down. Also write down every skipped trade that would have lost. At the end of the month, compare the two lists. In most cases, the skipped losers far outnumber the skipped winners.
The trader from the walkthrough reduced his frequency from three trades in week one to one trade per week for the rest of the month. His gross profit on those two patient trades ($58,000) more than covered the three losses ($30,000) from his high-frequency week.
He did not need to trade more. He needed to trade better.
How EdgeFlo Tracks Your Trade Frequency
EdgeFlo's dashboard tracks your win rate, average R, profit factor, and trade count in one view. You can see at a glance whether a high-trade-count week correlates with lower performance.
The discipline summary highlights weeks where your frequency exceeded your historical average, making it easy to spot when you are drifting into overtrading territory. This is not a restriction (EdgeFlo does not block trades). It is visibility that lets you catch the pattern before it costs money.
Over time, the data builds a clear picture of your optimal frequency range. Instead of guessing whether you should trade more or less, you have evidence.
The Edge Brief
Receive Insights on trading psychology, discipline, and the behavioral patterns that create consistent traders from our Founder and the EdgeFlo team, delivered to your inbox.
Think different. Trade different.
How many trades should I take per month?
Does a low trade count mean I am not active enough?
How do I know if I am overtrading?
Should I set a maximum trade count per week?

Turn discipline on.
Every session.
EdgeFlo is the environment serious traders operate inside.
Start 7-Day Trial — $7
Cancel anytime.
No long-term commitment.


Think Different, Trade Different.