

Session Volume Analysis: Find Which Window Pays You
Session volume analysis shows which trading window makes you money. Track results by session to find your most profitable hours and cut the rest.

You trade the London open, the New York overlap, and sometimes even the Asian session. You are busy for 12 hours a day. Your monthly P&L is flat. What if half those hours are costing you money while the other half are making it?
Most traders never check. They treat every session equally, even though the data would tell them otherwise. Session volume analysis breaks your results down by time window so you can see exactly which hours pay and which ones drain.
TL;DR
Break your trading results into session windows: London open, London/New York overlap, New York afternoon, and Asian session.
After 30 or more trades per session, compare win rate, average R, and total P&L by window.
Most traders discover that one session produces the bulk of their profits while another session silently erases them.
Cut the losing session. Double your focus on the winning one. Fewer hours, better results.
Track session data on your trading dashboard so the numbers stay visible, not buried in a spreadsheet.
Why Session Matters More Than You Think
Forex does not trade the same way at 3:00 AM EST as it does at 10:00 AM EST or 8:00 PM EST. Each session window has different characteristics: different levels of institutional participation, different volatility profiles, and different types of price movement.
The London open (3:00 AM to 6:00 AM EST) is when European banks and institutions enter the market. Price often breaks out of the Asian session range, sweeps liquidity, and establishes the first directional move of the day.
The London/New York overlap (8:00 AM to 11:00 AM EST) is the highest-volume window. Both European and American institutions are active. This is where the most volatile moves happen, and it is where most daily ranges get confirmed or reversed.
The New York afternoon (11:00 AM to 4:00 PM EST) often sees declining volume. The early move has already happened. Price may consolidate or drift.
The Asian session (8:00 PM to 3:00 AM EST) is typically low-volatility consolidation. Price ranges, candlesticks are small, and directional moves are rare.
Your strategy interacts differently with each of these environments. A breakout strategy might print money during London but get chopped apart during Asia. A range-trading approach might work during Asia but get blown out at the New York open. The only way to know is to measure.
How to Run a Session Volume Analysis
This is not complicated. It requires data you already have if you journal your trades.
Step 1: Tag Every Trade by Session
Go through your last 60 to 100 trades and label each one with the session it was taken in:
London Open (LO): 3:00 AM to 6:00 AM EST
London/New York Overlap (LNO): 8:00 AM to 11:00 AM EST
New York Afternoon (NYA): 11:00 AM to 4:00 PM EST
Asian (AS): 8:00 PM to 3:00 AM EST
If a trade was entered at 2:55 AM and ran into the London open, tag it by entry time. The session you entered in is what matters because that is the decision point.
Step 2: Calculate Per-Session Metrics
For each session bucket, calculate:
Total trades
Win rate (wins divided by total trades)
Average R (average risk-multiple per trade)
Total R (sum of all R-multiples)
Largest winner and largest loser
Step 3: Compare
Line up the sessions side by side. The answer usually jumps off the page.
Walkthrough: A Trader's Session Breakdown
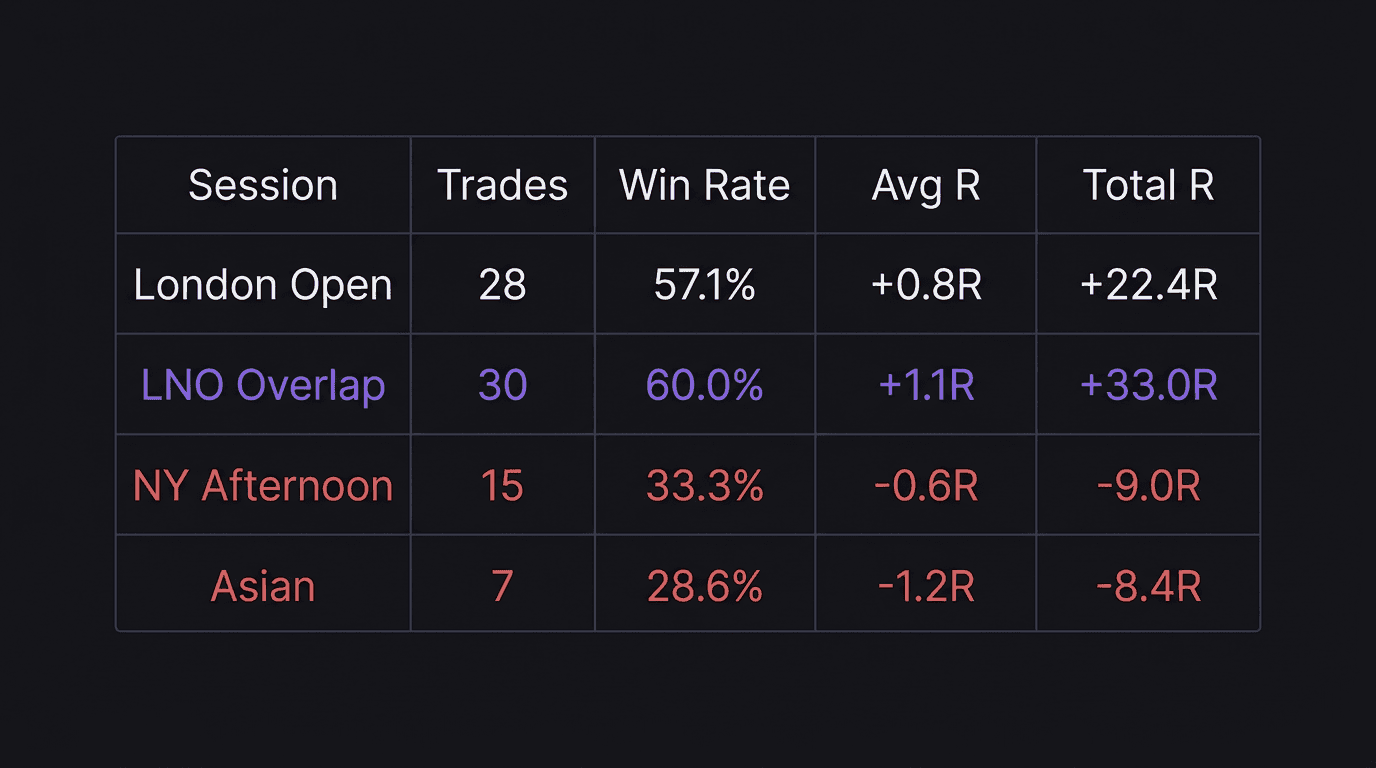
A trader takes 80 trades over 2 months. Here is the breakdown:
Session | Trades | Wins | Losses | Win Rate | Avg R | Total R |
|---|---|---|---|---|---|---|
London Open | 28 | 16 | 12 | 57.1% | +0.8R | +22.4R |
LNO Overlap | 30 | 18 | 12 | 60.0% | +1.1R | +33.0R |
NY Afternoon | 15 | 5 | 10 | 33.3% | -0.6R | -9.0R |
Asian | 7 | 2 | 5 | 28.6% | -1.2R | -8.4R |
Math check on London Open: 16 wins out of 28 = 57.1%. Total R = +22.4R across 28 trades, so Avg R = +22.4 / 28 = +0.8R. Verified.
Math check on LNO Overlap: 18 wins out of 30 = 60.0%. Total R = +33.0R across 30 trades, so Avg R = +33.0 / 30 = +1.1R. Verified.
Math check on NY Afternoon: 5 wins out of 15 = 33.3%. Total R = -9.0R across 15 trades, so Avg R = -9.0 / 15 = -0.6R. Verified.
Math check on Asian: 2 wins out of 7 = 28.6%. Total R = -8.4R across 7 trades, so Avg R = -8.4 / 7 = -1.2R. Verified.
The combined total is +22.4 + 33.0 - 9.0 - 8.4 = +38.0R across 80 trades. But look at what happens without the NY Afternoon and Asian sessions: +22.4 + 33.0 = +55.4R across 58 trades.
This trader would have made 45.8% more R by not trading two sessions. That is not a small difference. That is the difference between a mediocre quarter and a strong one.
What the Data Usually Reveals
After analyzing hundreds of trader journals, a consistent pattern emerges: most retail traders make money in one, maybe two sessions, and lose it back in the others.
The reasons are not mysterious:
Low-volume sessions produce noise. During the Asian session, price often consolidates in tight ranges. A strategy built for directional moves (breakouts, trend continuations) gets chopped apart by directionless price action. You take entries that trigger, but price has no follow-through.
Late-session fatigue. If you traded the London open and are still trading at 2:00 PM EST, your decision quality has declined. You are tired, less selective, and more likely to force trades that do not meet your criteria. The trade frequency data often shows that late-session trades are both more frequent and less profitable.
Different sessions require different strategies. The London open rewards reaction-based entries after liquidity sweeps. The Asian session rewards range-bound strategies. If you use the same approach in both, one session will pay and the other will cost.
Cutting the Losing Session
Once the data shows you a losing session, the next step is simple but uncomfortable: stop trading it.
This feels wrong. You think, "But what if the next Asian session trade is a winner?" Maybe it will be. But over 30 trades, the session has shown you a negative expectancy. One winner does not fix a structural disadvantage.
Here is a practical approach:
Eliminate the worst session first. If Asian session shows a -1.2R average across 7 trades, stop trading it immediately.
Put the second-worst session on probation. If NY Afternoon is negative but has fewer trades, give it 15 more trades. If it stays negative, cut it.
Focus your energy on your best session. For most forex traders, that is the London open or the London/New York overlap. Trade that window with full attention and preparation.
What happens next is that your equity curve cleans up. The choppy noise from bad sessions disappears. Your monthly stats improve not because you became a better trader, but because you stopped trading in environments that did not suit your approach.
The Quarterly Session Audit
Run this analysis once per quarter. As your strategy evolves, your session profile may change. A trader who switches from scalping to swing trading may find that the New York afternoon becomes profitable because their holding period is longer.
Pull up your monthly trading stats for the past three months. Break them by session. Compare against the previous quarter. Ask:
Did my best session stay consistent?
Did any new session become profitable?
Did I sneak trades back into a session I was supposed to cut?
That last question matters more than you think. Session drift is real. You cut Asian session in January, but by March you are taking "just one trade" during Asia because the chart looked good. Your data will catch this, but only if you keep tagging trades by session.
A Note on Sample Size
Seven trades in the Asian session is not enough data to make a permanent decision. It is enough to raise a flag, but not enough to convict.
You need a minimum of 20 to 30 trades per session before the win rate and average R stabilize. Below that, one or two outlier trades (a big winner or a big loser) can distort the entire picture.
If you only have 7 Asian session trades, the right move is not to eliminate that session permanently. The right move is to decide: "Am I going to take 23 more Asian session trades to collect the data, or am I going to skip it and focus on the sessions where I already have strong data?"
For most traders, the second option is smarter. Why allocate 23 more trades to a session you suspect is negative when you could allocate those trades to your proven window?
How to Review Sessions in Your Performance Dashboard
The session analysis integrates into your broader performance review process. Here is a simple quarterly review framework:
Export your last 90 days of trades.
Tag each trade by session (LO, LNO, NYA, AS).
Calculate the five metrics for each session (trades, win rate, avg R, total R, largest win/loss).
Compare against the previous quarter.
Make one decision: keep, probation, or cut for each session.
Set a calendar reminder for the next quarterly review.
This takes about 30 minutes once you have the habit. The payoff is structural: you stop spending energy on windows that do not pay and concentrate on the ones that do.
How EdgeFlo Tracks Your Session Data
EdgeFlo's trading dashboard shows your performance metrics, including win rate, average R, profit factor, and EdgeScore. Because every trade is auto-imported with a timestamp, filtering by session window is built into the data.
Instead of manually tagging trades, the journal captures the session automatically based on when the trade was executed. During your weekly or monthly review, you can see session-level breakdowns without maintaining a separate spreadsheet.
This visibility matters because the data stays in front of you. It is not buried in a CSV that you export once a quarter and forget about. Every time you open your dashboard, your session performance is right there. That persistent visibility makes it harder to ignore the numbers and easier to stick with the sessions that actually pay.
The Edge Brief
Receive Insights on trading psychology, discipline, and the behavioral patterns that create consistent traders from our Founder and the EdgeFlo team, delivered to your inbox.
Think different. Trade different.
What is session volume analysis in trading?
Which trading session has the highest volume?
How many trades do I need to analyze by session?
Should I stop trading sessions that show a negative result?

Turn discipline on.
Every session.
EdgeFlo is the environment serious traders operate inside.
Start 7-Day Trial — $7
Cancel anytime.
No long-term commitment.


Think Different, Trade Different.