

Track Every Market From One Dashboard: Multi-Asset Monitoring
Stop splitting your trading data across spreadsheets. A unified dashboard tracks win rate, R-multiples, and session stats across forex, futures, and stocks.

If you trade two markets, you probably track them in two different places. Maybe EUR/USD lives in a trading journal app and your NQ futures trades sit in a spreadsheet. Or your forex stats are in one broker's platform and your stock trades are in another.
That fragmentation creates blind spots. You might know your forex win rate is 35% but have no idea how it compares to your futures performance. You might think you are more profitable in stocks, but you have never measured both markets using the same metrics over the same time period.
A unified trading dashboard solves this by normalizing every trade into the same language: R-multiples, percentages, and session windows. When every trade speaks the same language, you can finally see which market actually pays you.
TL;DR
Fragmented tracking hides your real performance by splitting data across tools.
Unified metrics (win rate, average R, expectancy) let you compare any market against any other.
Most traders discover one market significantly outperforms the others when they see the data side by side.
Session-based filtering reveals whether your edge comes from the market or the time of day.
Cross-market data tells you where to focus, not where to diversify.
The Problem With Separate Spreadsheets
Every trader who tracks their performance starts simple. One spreadsheet. Maybe a few columns: date, pair, direction, result. It works for 20 trades.
Then they add a second market. Now they need a second tab, or a second file, or a second app. The metrics start drifting. The forex spreadsheet tracks pips. The futures spreadsheet tracks ticks. The stock spreadsheet tracks dollars. None of them speak the same language.
After three months, you have 80 forex trades and 40 futures trades. You want to answer a simple question: "Am I a better forex trader or futures trader?" But your forex trades are measured in pips and your futures trades are measured in ticks. The position sizes are different. The pip values are different. You cannot compare them directly.
This is not a minor inconvenience. It is a blind spot that prevents you from making one of the most important decisions in trading: where to focus your time.
The fix is measuring everything in R-multiples. If you risked $500 and made $1,500, that is a 3R win regardless of whether it was forex pips or futures ticks. One unit of measurement. Universal comparison.
What a Unified Dashboard Shows You
When every trade flows into one dashboard with the same metrics, patterns emerge that you could never see in fragmented data.
Cross-market win rate: Your forex win rate might be 34% while your futures win rate is 42%. That difference is invisible when the data lives in two places.
R-multiple comparison: Maybe your average forex winner is 2.8R but your average futures winner is only 1.9R. The higher win rate in futures might not compensate for the smaller winners.
Expectancy by market: This is the number that matters. Expectancy combines win rate and R-multiple into one metric that tells you how much you make per unit of risk. A market with 34% win rate and 2.8R average winner might have higher expectancy than a market with 42% win rate and 1.9R average winner.
Session performance: You might win consistently during London session forex trades but lose consistently during New York session futures trades. Without unified tracking, you would never see that your session matters more than your market.
Walkthrough: Finding the Hidden Winner
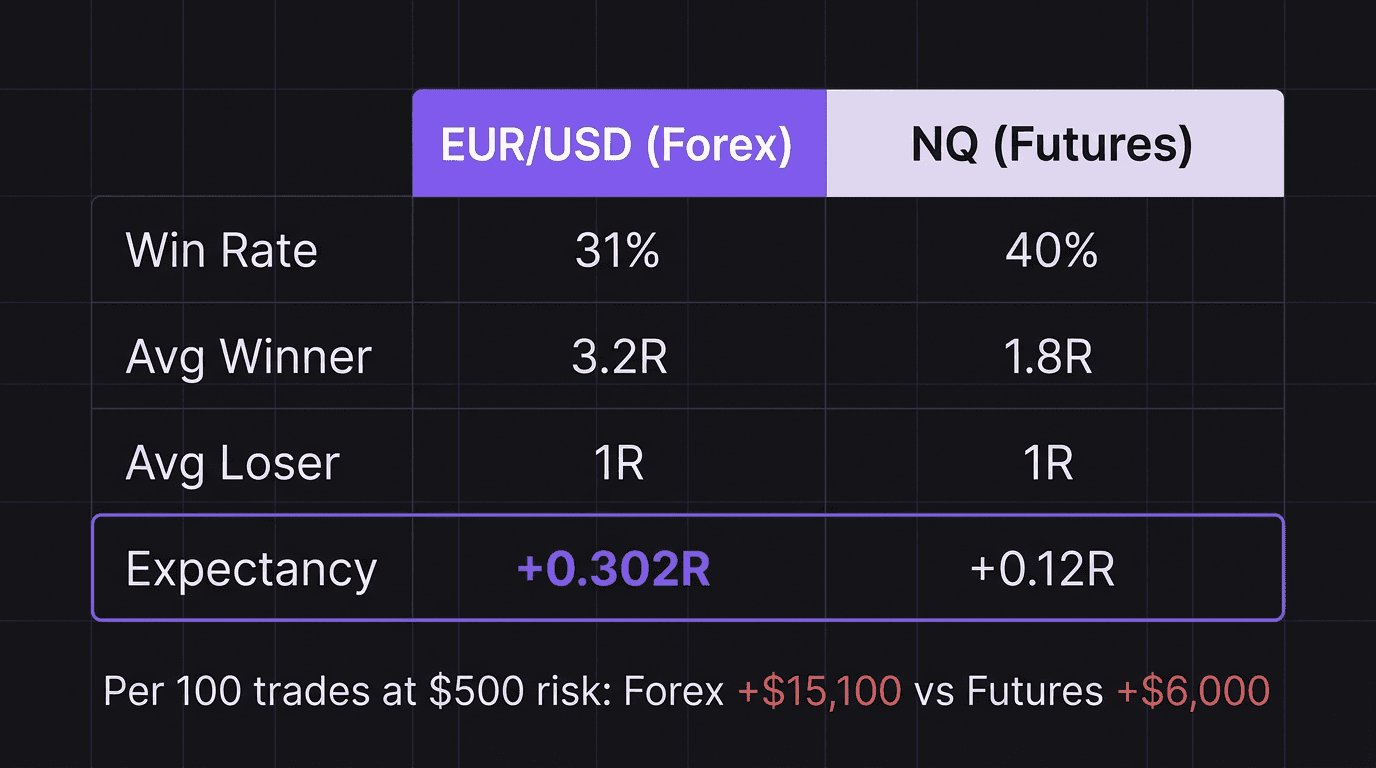
Trader Profile: Trades EUR/USD (forex) and NQ (futures). Six months of data. 120 forex trades and 85 futures trades.
Forex Stats: - Win rate: 31% - Average winner: 3.2R - Average loser: 1R - Expectancy: (0.31 x 3.2R) minus (0.69 x 1R) = 0.992R minus 0.69R = +0.302R per trade
Math check: - 0.31 x 3.2 = 0.992. - 0.69 x 1 = 0.69. - 0.992 minus 0.69 = 0.302.
Futures Stats: - Win rate: 40% - Average winner: 1.8R - Average loser: 1R - Expectancy: (0.40 x 1.8R) minus (0.60 x 1R) = 0.72R minus 0.60R = +0.12R per trade
Math check: - 0.40 x 1.8 = 0.72. - 0.60 x 1 = 0.60. - 0.72 minus 0.60 = 0.12.
Verdict: Forex wins by 2.5x on expectancy despite the lower win rate. The 40% futures win rate felt better emotionally (more wins), but the 3.2R forex winners create a significantly larger edge per trade. Without unified tracking, this trader might have assumed futures was their stronger market based on how often they win.
Dollar impact over 100 trades at $500 risk per trade: - Forex: 100 x 0.302 x $500 = $15,100 - Futures: 100 x 0.12 x $500 = $6,000 - Difference: $9,100 in forex's favor
Key Metrics That Cross Markets
Some metrics are market-specific (pips, ticks, lot sizes). Others translate perfectly across every instrument. Focus your dashboard on these universal metrics:
Win rate: Total wins divided by total trades. Works the same whether you trade EUR/USD or Apple stock or NQ futures.
Average R-multiple (winners): Average profit expressed as a multiple of the risk taken. If you risk $500 and your average winner is $1,400, your average R is 2.8. This normalizes across lot sizes, tick values, and share prices.
Average R-multiple (losers): Should be close to 1R if your stop discipline is solid. If your average loser is 1.4R, you have a stop-management problem regardless of what market you trade.
Expectancy per trade: (Win rate x Average R winner) minus (Loss rate x Average R loser). This is the single most important number in your trading performance review.
Profit factor: Total gross profit divided by total gross loss. A profit factor of 1.5 means you make $1.50 for every $1 you lose. It works the same in every market.
Trade frequency: How many trades per week or per session. A high-frequency forex approach and a low-frequency swing stock approach will have very different trade counts, and that difference matters when comparing monthly returns.
Finding Your Best Market Through Data
The point of cross-market tracking is not to trade more markets. It is to discover which market deserves more of your time.
After 3 to 6 months of unified data, ask these questions:
Which market has the highest expectancy per trade? That is where your edge lives. Even if it "feels" harder or less exciting, the numbers tell the truth.
Which session within that market performs best? You might be profitable in GBP/USD overall but negative during Asian session and strongly positive during London session. Session filtering narrows your focus further.
Which market has the smoothest equity curve? Two markets might have similar expectancy, but if one produces wild swings and the other compounds steadily, the smooth curve is easier to trade psychologically and easier to manage on a funded account.
Where do you overtrade? Check your monthly trading stats by market. If you take 15 trades per week in crypto but only 5 per week in forex, and your per-trade expectancy is similar, the crypto volume might be costing you through commission drag and emotional fatigue.
The data does not just show you where to go. It shows you where to stop. And knowing which market to leave is often more valuable than knowing which market to enter.
How EdgeFlo Unifies Multi-Market Tracking
EdgeFlo's trading dashboard supports multiple asset classes in a single view. Every trade, whether it is a EUR/USD position, an NQ futures contract, or a stock swing trade, gets normalized into the same metrics: R-multiples, expectancy, profit factor, and session-based performance.
Filter by market to see your forex stats isolated. Toggle to futures to compare. View them side by side to find your strongest instrument. The dashboard calculates expectancy for each market automatically, so the comparison from the walkthrough above (forex at +0.302R versus futures at +0.12R) appears without manual spreadsheet work.
Session performance tracking crosses markets too. If you trade forex during London and futures during New York, EdgeFlo shows whether your edge comes from the market, the session, or the combination. That clarity tells you exactly where to point your attention and where to stop wasting it.
Can I track forex and futures trades in the same dashboard?
What metrics work across all markets?
Does tracking multiple markets mean I should trade multiple markets?
How many trades do I need before cross-market comparisons are meaningful?

Turn discipline on.
Every session.
EdgeFlo is the environment serious traders operate inside.
Start 7-Day Trial — $7
Cancel anytime.
No long-term commitment.


Think Different, Trade Different.