

Monthly Trading Stats That Actually Matter
Win rate alone is misleading. Learn which monthly stats reveal your real trading edge, with a real 5-trade month that netted $27K on a 40% win rate.

A 40% win rate sounds terrible until you realize it produced $27,000 in a single month. The number that matters is not how often you win. It is how much you make when you win versus how much you lose when you lose.
Most traders obsess over win rate because it feels intuitive. Higher percentage equals better trader, right? Wrong. A trader with 80% win rate and tiny winners can lose money every month. A trader with 40% win rate and winners that are 3x to 5x larger than losers builds real wealth. Your monthly stats tell this story, but only if you track the right numbers.
TL;DR
Win rate alone is meaningless without knowing average R per trade and profit factor.
A real month: 5 trades, 40% win rate, +1.5R net, $27,000 profit.
The four stats that matter: win rate, average R, trade count, and profit factor.
Low trade count with high selectivity consistently outperforms high trade count with low selectivity.
Review your stats monthly to catch process drift before it costs you.
The Stats That Actually Matter
Your trading dashboard should surface four numbers every month. Everything else is secondary.
Win rate tells you how often you are right. By itself, it is incomplete. But combined with average R, it reveals your edge.
Average R per trade tells you the relationship between your winners and losers. If your average winner is 2.5R and your average loser is 1R, you have an asymmetric edge that works even at low win rates.
Trade count reveals your selectivity. Fewer trades with the same win rate and average R means you are filtering for quality. More trades often means you are forcing setups that do not meet your criteria.
Profit factor is your gross wins divided by gross losses. A profit factor of 1.0 means you are breaking even. Above 1.5 means your edge is meaningful. Above 2.0 is strong. This single number captures the relationship between all the other stats.
If your win rate is 40%, your average winner is 2.5R, and your average loser is 1R, your expectancy per trade is:
(0.40 x 2.5) - (0.60 x 1.0) = 1.0 - 0.6 = +0.4R per trade.
That means every trade you take, on average, is worth +0.4R. Over 5 trades, that is +2.0R. Over 100 trades, that is +40R. The win rate does not need to be high if the R:R ratio is doing the heavy lifting.
A Real Month: 5 Trades, 40% Win Rate, +1.5R
Here is what a real month of trading stats looks like when tracked properly.
Walkthrough: June Trading Stats Breakdown
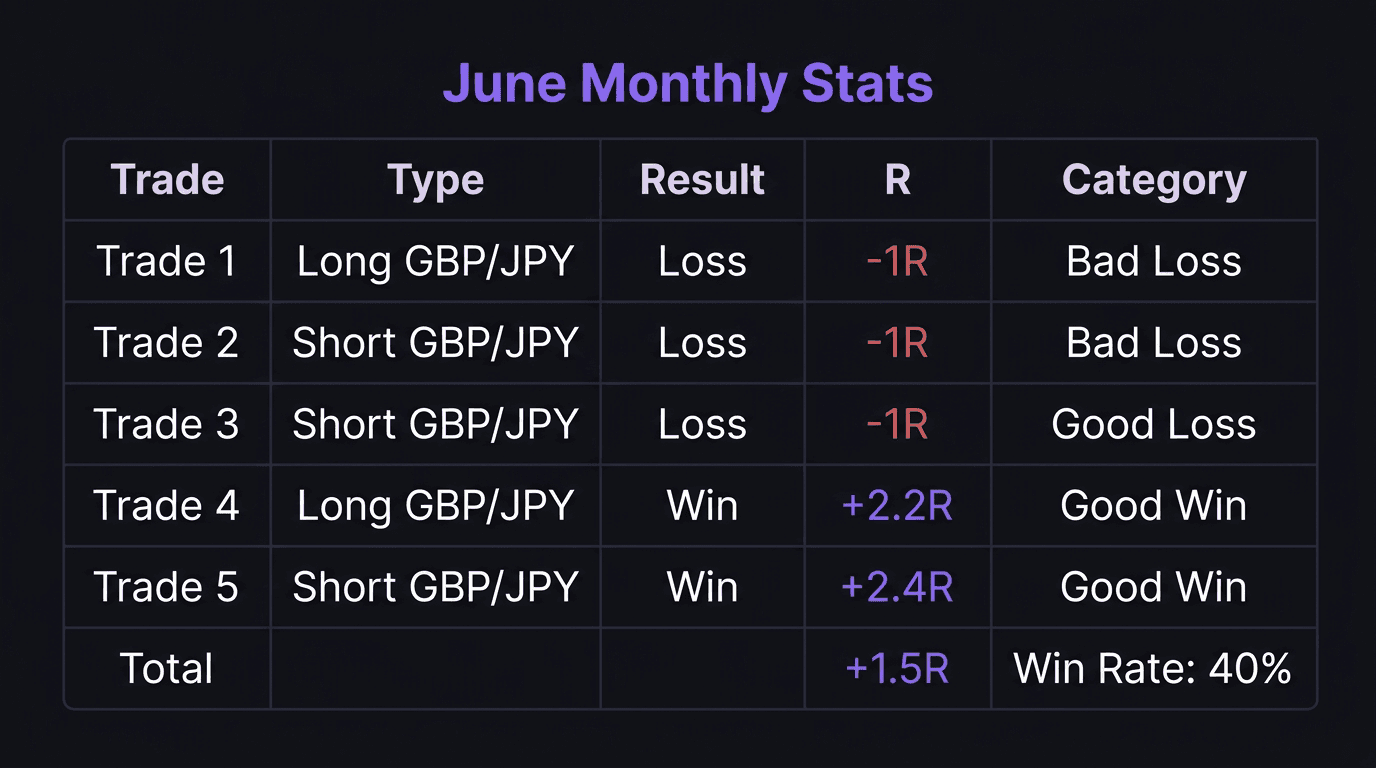
Month: June. Pair: GBP/JPY. Total trades: 5. Wins: 2. Losses: 3. Win rate: 40%.
Trade 1 (Week 1): Long entry before confirmation, impulse trade. Hit stop loss at 1R. Loss: $10,000. Bad loss (rule-breaking).
Trade 2 (Week 1): Short entry ignoring bullish signals, ego-driven. Hit stop loss at 1R. Loss: $10,000. Bad loss (rule-breaking).
Trade 3 (Week 1): Short entry following plan, fractal market shift confirmed. Hit stop loss at 1R. Loss: $10,000. Good loss (variance).
Trade 4 (Week 3): Long entry at higher low after liquidity sweep. Hit 2.2R. Profit: approximately $22,000. Good win (plan-following).
Trade 5 (Week 4): Short entry at supply zone after equal highs swept. Closed manually at 2.4R. Profit: approximately $36,000. Good win (plan-following, early exit due to overnight hold concern).
Net R: +1.5R. Net profit: approximately $27,000 after fees. Profit factor: approximately 1.9.
Look at what these stats reveal. The win rate (40%) looks bad in isolation. But the average winner (2.3R) dwarfs the average loser (1R), creating a profit factor near 1.9. The month was profitable not because of accuracy but because of asymmetry.
Now look at trade count. Only 5 trades in an entire month. Three came in the first week (two of which broke the plan). The last two came weeks apart, each one a high-quality A+ setup. The low trade count reflects extreme selectivity after the losing streak.
What Your Numbers Reveal About Process
Stats are not just a scorecard. They are a diagnostic tool. Here is what to look for in your monthly review.
If win rate is high but average R is low: You are cutting winners short or letting losers run. Your exits need work. You might be moving to break even too early or taking profit at 1R when your setup can deliver 2R or 3R.
If win rate is low but average R is high: Your entry filter is tight and your R:R is strong. This is sustainable if the math works (positive expectancy). But check whether the low win rate is causing you psychological problems. Some traders cannot handle losing 6 out of 10 trades even when the math is in their favor.
If trade count is increasing month over month: You are probably loosening your entry criteria. More trades is not inherently bad, but if average R per trade is dropping at the same time, you are adding noise, not signal. Compare your R per trade from high-volume months to low-volume months.
If profit factor is below 1.0: You are losing money. Either your winners are too small, your losers are too large, or both. Before anything else, check if you are following your plan. The case study showed that when the trader broke his rules (trades 1 and 2), he produced bad losses. When he followed the plan (trades 3, 4, and 5), he had one variance loss and two strong wins.
This is why categorizing losses as "good" or "bad" matters. A performance review that separates plan-following trades from rule-breaking trades shows you whether the problem is your strategy or your discipline.
Build a Monthly Stats Dashboard
Here is how to set up a monthly review that takes 30 minutes and tells you everything you need to know.
Step 1: Pull your trade data. List every trade from the month with entry date, pair, direction, R result, and whether you followed your plan.
Step 2: Calculate the four core stats. Win rate, average R per trade, total trade count, profit factor. If you track these consistently, you can spot trends across months.
Step 3: Categorize each trade. Mark each trade as one of four types: good win (plan-following, positive R), bad win (rule-breaking, positive R), good loss (plan-following, negative R), bad loss (rule-breaking, negative R). The "bad win" category is important because it disguises poor process behind a lucky outcome.
Step 4: Compare to previous months. Is your trade count going up or down? Is your average R stable? Is your profit factor trending? These trends matter more than any single month's result.
Step 5: Write one sentence about what you will change. Not five changes. One. The most impactful thing you learned from this month's data. In the case study, the trader's takeaway was simple: wait for A+ setups only. That one filter transformed the rest of his month.
Your equity curve tells the story visually, but the underlying stats explain why the curve moves the way it does. Track both. Review monthly. Hold yourself accountable to the numbers, not to feelings.
How EdgeFlo Tracks Your Monthly Stats
EdgeFlo's dashboard automatically calculates win rate, average R, profit factor, and EdgeScore from your imported trades. You do not need to build a spreadsheet or pull data manually.
The discipline summary shows which trades followed your plan and which ones deviated, so your monthly review already has the good-loss versus bad-loss categorization built in. Instead of spending an hour sorting trades, you open the dashboard and the data is waiting.
Over time, the monthly trend lines reveal whether your process is improving or drifting. If your profit factor drops from 1.8 to 1.2 across three months, the dashboard surfaces that trend before the damage compounds.
The Edge Brief
Receive Insights on trading psychology, discipline, and the behavioral patterns that create consistent traders from our Founder and the EdgeFlo team, delivered to your inbox.
Think different. Trade different.
What trading stats should I track monthly?
Can you be profitable with a 40% win rate?
What is a good profit factor for trading?
How many trades per month is enough for reliable stats?

Turn discipline on.
Every session.
EdgeFlo is the environment serious traders operate inside.
Start 7-Day Trial — $7
Cancel anytime.
No long-term commitment.


Think Different, Trade Different.