

R Multiples: Fixed Targets vs Technical Exits
Learn how R multiples measure trade performance. Compare fixed R targets with technical exits and see how to track R over time.

An R multiple measures your trade outcome as a ratio of the risk you took. If you risk $100 and make $300, that is a +3R trade. If you risk $100 and lose it, that is a -1R trade. R strips away dollar amounts and position sizes so you can compare trades on equal terms.
R multiples answer the question that dollar P&L cannot: "Relative to what I risked, how well did this trade pay?"
TL;DR
R multiples express profit and loss as a multiple of your initial risk amount.
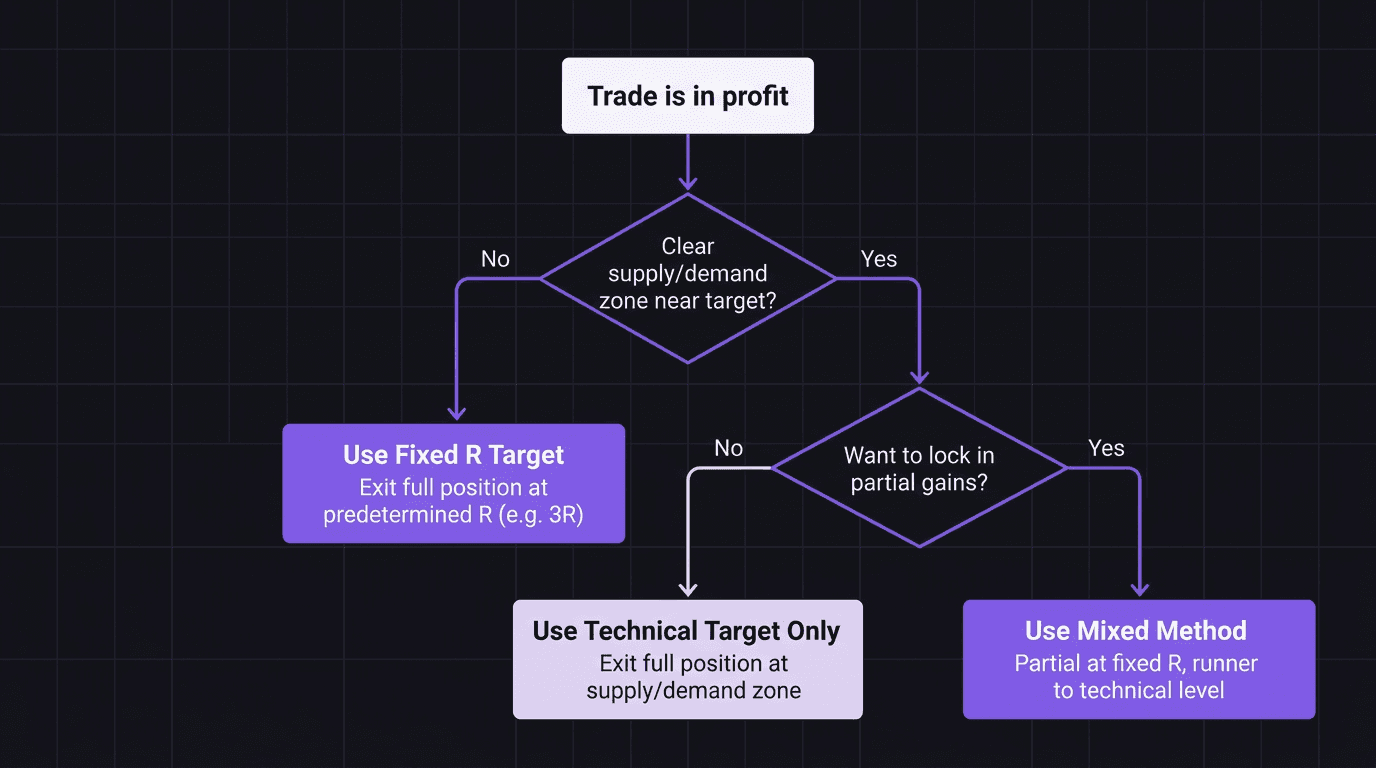
Fixed R targets (exit at 2R, 3R, 5R) are simple, consistent, and easy to backtest.
Technical targets (exit at a supply zone or swing high) adapt to market structure.
Combining both methods (partial at fixed R, runner to technical level) captures the strengths of each.
Track average R monthly to measure your real edge over time.
What R Multiples Actually Measure
Most traders track dollars won and lost. Dollars feel real. But dollars lie about performance.
A trader who makes $500 on a $10,000 account risking 1% ($100) per trade earned 5R. A trader who makes $500 on a $50,000 account risking 1% ($500) per trade earned 1R. Same dollars. Vastly different performance.
R normalizes everything. Here is the formula:
R = (Exit Price minus Entry Price) / (Entry Price minus Stop Loss Price)
For a long trade where you entered at 1.0850, stop at 1.0820, and exited at 1.0940: R = (1.0940 minus 1.0850) / (1.0850 minus 1.0820) = 0.0090 / 0.0030 = +3R.
For a loss where you entered at 1.0850, stop at 1.0820, and got stopped out: R = (1.0820 minus 1.0850) / (1.0850 minus 1.0820) = -0.0030 / 0.0030 = -1R.
R tells you how many units of risk you gained or lost. It works the same whether you are trading micro lots or standard lots, whether your account is $500 or $500,000.
This is why trading expectancy is calculated in R, not dollars. Expectancy = (Win Rate x Average Win in R) minus (Loss Rate x Average Loss in R). If your average winner is +2.5R, your average loser is -1R, and your win rate is 40%, your expectancy is (0.40 x 2.5) minus (0.60 x 1.0) = 1.0 minus 0.6 = +0.4R per trade.
That number tells you more about your edge than any monthly P&L screenshot.
Fixed R Targets: The Simple Approach
Fixed R targets mean you decide before entry exactly what R level triggers your exit. "I exit all trades at 3R" is a fixed R rule. "I take partial at 2R and close the rest at 5R" is another.
The advantage is consistency. Every trade follows the same exit logic. There is no in-the-moment judgment about whether a supply zone looks strong enough, whether the trend is losing momentum, or whether you "should take profit here." Price hits 3R. You close. Done.
Fixed R also makes backtesting straightforward. You do not need to identify supply zones or structure levels retrospectively. You just measure: if I entered here with this stop, would price have reached 3R before hitting my stop? Yes or no. Repeat for 200 trades. Calculate average R.
Walkthrough: Fixed 3R Target on EUR/USD
You enter long on EUR/USD at 1.0850. Stop loss at 1.0820 (30 pips = 1R). Your fixed target is 3R, which means your take profit is 90 pips above entry: 1.0940.
Risk: 1% of $10,000 = $100. Position: 0.33 lots (30 pips x $10/pip x 0.33 = $99).
Price rallies to 1.0935, pulls back to 1.0900, then pushes to 1.0940. Your limit order fills at 1.0940. You collect +3R = $300.
But here is what you missed: price continued to 1.0990 after your exit. That is another 50 pips (+1.67R) you left on the table. With a fixed R target, you always leave money on the table when the trend continues.
Fixed R trades the certainty of a defined exit for the occasional missed runner. If your strategy generates setups that regularly push past your fixed target, you may want a higher R target or a hybrid approach.
Technical Targets: Exit at Key Levels
Technical targets mean you exit at a specific price level based on chart structure: a supply zone, a swing high, an area of equal highs, or any level where you expect price to reverse.
This approach adapts to the market. A 1.0850 entry might target 1.0940 (a 3R supply zone) on one trade and 1.0990 (a 4.7R higher-timeframe supply zone) on another. The target changes based on where the structure points, not a fixed ratio.
The source transcript describes this clearly: "When I buy at a demand zone, I take profit at the next supply zone." The exit level is determined by the supply and demand structure on the chart, not by a predetermined R number.
The advantage is that your exits align with where the market is actually likely to reverse. A supply zone at 3.2R is more meaningful than an arbitrary 3R line because real selling pressure sits at that level.
The disadvantage is subjectivity. Two traders can look at the same chart and identify different supply zones. Your "obvious" target might not be where price actually reverses. And backtesting technical targets requires manually identifying zones for every historical trade, which is slow and inconsistent.
Walkthrough: Technical Target at Supply Zone on GBP/USD
You enter long on GBP/USD at 1.2700 after a bounce off demand. Stop loss at 1.2660 (40 pips, 1R). A 4H supply zone sits at 1.2830, which is 130 pips above entry (3.25R).
A fixed 3R trader would set TP at 1.2820 (120 pips). A technical target trader sets TP at 1.2830 (130 pips, 3.25R) because that is where the selling pressure sits.
Price runs to 1.2825, stalls for two candles, then pushes through to 1.2830 and reverses. Your TP fills. You collect 3.25R instead of 3R.
The extra 0.25R is small on one trade, but over 100 trades it adds up: 25R of additional profit from letting the market tell you where to exit.
Technical targets work best when you have a clear, repeatable method for identifying exit zones. If your zone identification is inconsistent, your results will be inconsistent.
Mixing Fixed R with Technical Exits
The transcript describes combining both methods, and this is often the most practical approach. You use a fixed R level for partial profits and a technical level for the runner.
Example rule: "Take 50% off at 3R. Let the remaining 50% run to the next higher-timeframe supply zone."
This gives you the consistency of a fixed partial exit (you always take profit at 3R, no judgment required) with the adaptability of a technical runner (the remaining position exits where the market structure tells you to).
Entry: 1.0850. Stop: 1.0820 (30 pips, 1R). Position: 0.2 lots.
Partial: close 0.1 lots at 1.0940 (3R). Realized: 90 pips x $10/pip x 0.1 = $90.
Runner target: 4H supply zone at 1.0980 (4.33R). If it hits: 130 pips x $10/pip x 0.1 = $130.
Total best case: $90 + $130 = $220 (vs $180 at fixed 3R on full position).
If runner gets stopped at entry (break even on runner): $90 + $0 = $90 (vs $0 or -$60 loss at stop).
The mixed approach sacrifices some upside on clean runners but protects you on trades where price reverses after your partial level.
Track every trade's R outcome in your journal, regardless of which exit method you used. Over 50+ trades, your average R will tell you which approach your strategy actually performs best with. Review your performance monthly and let the data drive your decision.
Your equity curve should show steady growth with manageable drawdowns. If your average R is positive but your curve is choppy, the exit method may be creating inconsistent outcomes. Refine the rules until the curve smooths out.
How EdgeFlo Tracks R Performance
EdgeFlo's dashboard tracks your average R, profit factor, and win rate across all trades. You can filter by time period to see if your edge is improving, holding steady, or degrading.
The dashboard calculates R automatically from your entry, stop, and exit prices. You do not need to compute it manually for every trade. Just enter your trades (or let the auto-import handle it), and your R stats update in real time.
Over time, your average R becomes the single most important number in your trading. It tells you whether your exit strategy is working, independent of market conditions, account size, or position sizing. Track it. Obsess over it. A rising average R means your edge is sharpening.
The Edge Brief
Receive Insights on trading psychology, discipline, and the behavioral patterns that create consistent traders from our Founder and the EdgeFlo team, delivered to your inbox.
Think different. Trade different.
What is an R multiple in trading?
What is a good average R multiple?
Should I use fixed R or technical targets?
How do I track R multiples over time?

Turn discipline on.
Every session.
EdgeFlo is the environment serious traders operate inside.
Start 7-Day Trial — $7
Cancel anytime.
No long-term commitment.


Think Different, Trade Different.