

Stop Switching Markets: How Jumping Around Destroys Your Edge
Market hopping resets your pattern recognition to zero. Learn why committing to one market for 6 months builds the edge that jumping never will.

Every trader who has spent six months bouncing between forex, crypto, futures, and stocks knows this feeling: you start seeing patterns in EUR/USD, then someone posts a killer NQ scalp on social media, so you switch. Two weeks later, crypto is pumping, and suddenly you are studying Bitcoin charts. Three months pass and you have zero edge in any of them.
Market hopping is one of the most expensive habits in trading. Not because any single switch costs you money directly, but because every switch resets your learning curve to zero. The patterns you were starting to recognize? Gone. The session rhythms you were internalizing? Erased. The intuition you were building through repetition? Back to square one.
TL;DR
Every time you switch markets, you reset 3 to 6 months of pattern recognition progress.
Shiny object syndrome feels logical in the moment but compounds into years of stagnation.
Committing to one market, one style, and one session window for 6 months minimum is how real edge develops.
Your data tells you when to adjust. Without 100+ trades in one market, you have no data to evaluate.
Track your progress over months, not days, to see whether your system actually works.
The Reset Problem: Every Switch Costs 6 Months
Pattern recognition is not a concept you learn once. It is a skill you build through repetition, and it is specific to the market you trade.
A trader who spends three months watching GBP/USD during London session starts noticing how price reacts around equal highs before a session sweep. They begin to feel when a pullback is a trap versus a genuine continuation. That feeling is not mystical. It comes from hundreds of hours watching the same instrument move in the same session window.
When that trader switches to NQ futures, none of that transfers. The tick value is different. The volatility profile is different. The session personality is different. The way price responds to news is different. They are starting from zero, even though they might not realize it.
This is the hidden tax of strategy hopping. You pay it with time, not money, which makes it invisible until you look back and realize you have been trading for two years without building any real depth.
Walkthrough: The Two-Year Comparison
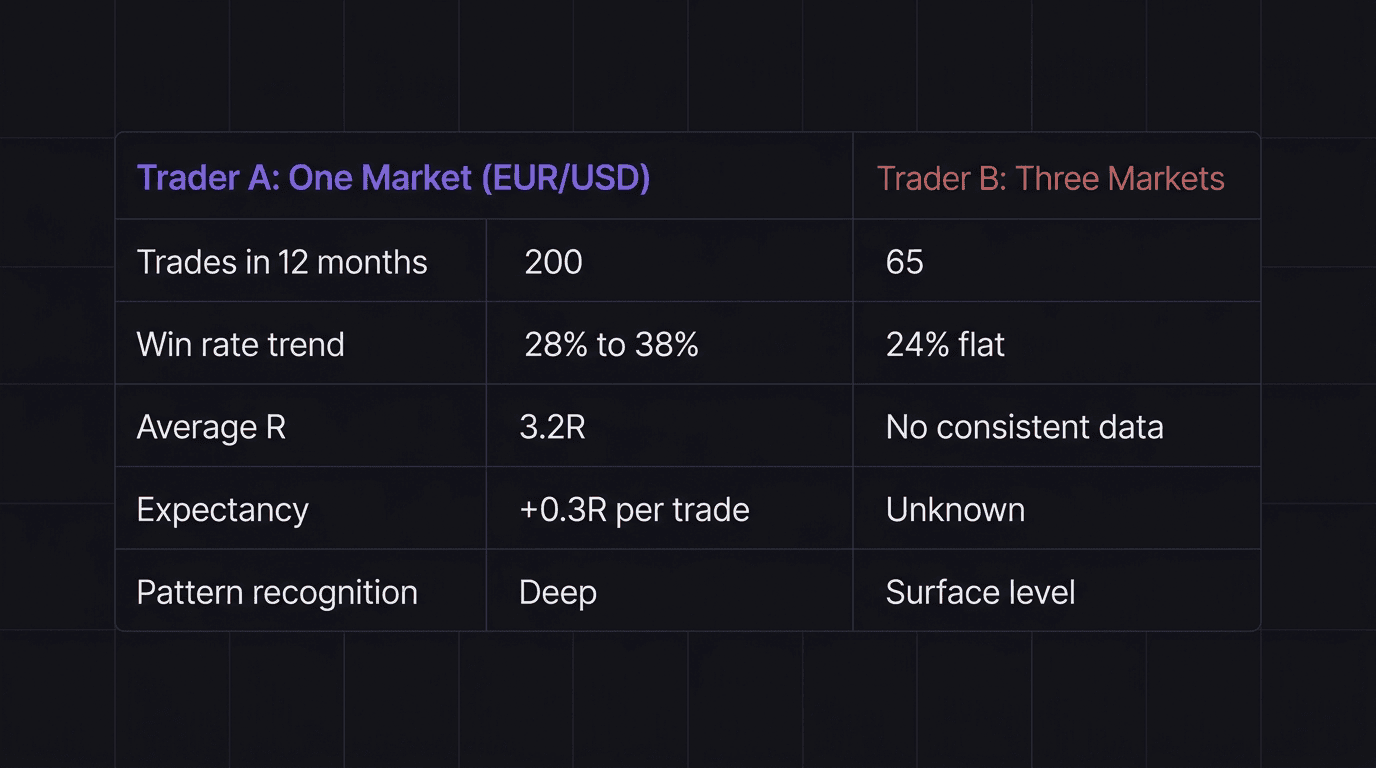
Trader A picks EUR/USD and commits for 12 months. In months 1 through 3, they struggle. Win rate sits around 28%. By month 6, pattern recognition kicks in and they hit 35%. By month 12, they consistently run a 38% win rate with a 3.2R average winner. Over 200 trades, their expectancy is positive at 0.3R per trade.
Trader B switches markets every 8 weeks. Months 1 through 2: EUR/USD (25 trades, not enough data). Months 3 through 4: NQ futures (18 trades, still learning tick value). Months 5 through 6: Bitcoin (22 trades, volatility too different). After 12 months, they have 65 trades scattered across three markets. No market has enough sample size to calculate meaningful expectancy. Their combined win rate is 24% with no improvement trend.
Same effort. Same hours. Wildly different outcomes.
Why Traders Keep Jumping (And Why It Feels Logical)
The urge to switch markets is not irrational. It actually feels like smart decision-making in the moment. That is what makes it so dangerous.
Here is the typical cycle. You start trading EUR/USD. First two weeks are exciting. You learn about session timing, pips, lot sizes. Then you hit a losing streak. Five losses in a row. Your strategy "does not work" in this market. Meanwhile, a friend posts screenshots of crypto gains. Bitcoin just moved 8% in one day. EUR/USD moved 0.4%.
So you think: "The opportunity is clearly in crypto right now. I will come back to forex when it is trending."
That thought has killed more trading edges than any bad entry. Because here is the truth: every market goes through periods where your strategy underperforms. That is not a market problem. That is a sample size problem. Five trades is not enough to evaluate anything. You need at least 100 before your metrics stabilize.
When you switch during a drawdown, you are not making a data-driven decision. You are making an emotional one. The market did not fail you. You did not give it enough time to prove whether it works.
Shiny Object Syndrome vs Real Progress
Shiny object syndrome in trading looks like this: you watch a YouTube video about a futures trader making $2,000 in 15 minutes and suddenly your forex strategy that makes $400 per week feels inadequate. So you open a futures account. Now you are learning about tick value, contract rollovers, and margin requirements instead of refining the strategy that was actually showing promise.
Real progress looks boring. It looks like trading the same pair, in the same session, using the same setup, for months. Your journal fills up with similar entries. Your backtest data starts forming patterns you can trust. Your confidence comes from proof, not motivation.
Sound familiar? Most traders have been through this cycle at least twice. Some are still in it.
The fix is not finding the "right" market. The fix is staying in one market long enough to know whether your approach works or not. You cannot know that in two weeks. You cannot know it in two months. Six months gives you enough data. Twelve months gives you mastery.
The Commitment Framework: 6 Months Minimum
Here is a practical framework for stopping the cycle:
Month 1: Pick one market, one session window, and one style (scalp, day trade, or swing). Document your rules. Start logging every trade.
Months 2 through 3: Execute your plan daily. Do not change anything yet. Your only job is collecting data. You will want to quit. That impulse is the exact moment your pattern recognition is starting to form underneath the surface.
Month 4: Review your first 50 to 80 trades. Look at win rate by session, average R, and which setup variations performed best. Make one small adjustment based on data, not feeling.
Months 5 through 6: Continue executing. By now you should notice that certain price behaviors feel familiar. You start anticipating moves before they complete. This is the pattern recognition payoff that only comes from simplicity and repetition.
At the 6-month mark, evaluate with data. If your expectancy is positive over 100+ trades, stay and refine. If it is clearly negative despite disciplined execution, then you have earned the right to consider a change, because now you have the data to justify it.
What a 6-Month Commitment Actually Produces
Setup: A trader commits to GBP/USD during London session (8:00 to 11:00 AM GMT) with a single pullback entry strategy. Risk: 1% per trade on a $50,000 account ($500 risk per trade). Target: 3R.
Months 1 through 3: 45 trades. Win rate: 26%. Average winner: 2.8R. Expectancy: (0.26 x $1,400) minus (0.74 x $500) = $364 minus $370 = negative $6 per trade. Essentially breakeven.
Math check: - 0.26 x $1,400 = $364. - 0.74 x $500 = $370. - $364 minus $370 = negative $6.
Months 4 through 6: 55 trades. Win rate: 33% after removing one low-quality variation. Average winner: 3.1R. Expectancy: (0.33 x $1,550) minus (0.67 x $500) = $511.50 minus $335 = positive $176.50 per trade.
Math check: - 0.33 x $1,550 = $511.50. - 0.67 x $500 = $335. - $511.50 minus $335 = $176.50.
That improvement only happened because 100 trades in the same market revealed which variation to cut. A market-hopper with 30 trades scattered across three instruments would never see that signal.
How EdgeFlo Shows You Progress Over Time
Knowing whether your commitment is working requires data you can actually see. EdgeFlo's trading dashboard tracks your long-term performance trends across weeks and months, not just individual trades. You can filter by session, by setup type, and by time period to watch your consistency metrics develop over your 6-month commitment window.
When your win rate climbs from 26% to 33% over 100 trades in one market, the equity curve shows that progression. When your average R improves because you removed one bad setup variation, the dashboard reflects it. The numbers do not care about shiny objects or what someone else posted on social media. They care about repetition and refinement.
That feedback loop (trade, review, adjust, repeat, all in one market) is how depth compounds into edge. EdgeFlo keeps the data visible so you can trust the process instead of chasing the next instrument.
How long should I stick with one market before switching?
Does trading multiple markets improve diversification?
What if my chosen market goes through a slow period?
Can I trade two markets at once as a beginner?

Turn discipline on.
Every session.
EdgeFlo is the environment serious traders operate inside.
Start 7-Day Trial — $7
Cancel anytime.
No long-term commitment.


Think Different, Trade Different.