

Stop Loss Placement: Place It Right or Skip the Trade
Place your stop loss based on structure first, then calculate R:R. If the ratio falls below 1:2, skip the trade entirely. Here's how.

Your stop loss placement strategy determines your risk-to-reward ratio, not the other way around. Most traders get this backwards. They pick a tight stop loss first because it makes the R:R look impressive on screen, then wonder why they keep getting stopped out before the trade moves in their favor. The correct order: place your stop loss where the trade idea becomes invalid based on price structure, calculate your R:R from that distance, and skip the trade if the ratio falls below 1:2.
TL;DR
Place your stop loss at the structural level that invalidates your trade idea, not at an arbitrary distance that inflates R:R.
Calculate risk-to-reward after placing the stop loss. The stop determines the R, not the other way around.
If R:R falls below 1:2 after correct placement, skip the trade entirely.
A tight stop loss designed to fake a high R:R will get you stopped out repeatedly, then you watch the trade run without you.
Structure-based stop placement keeps you in trades that deserve to play out and filters out trades that don't qualify.
The Tight Stop-Loss Trap
Ever placed a stop loss just 10 pips behind your entry because it made the risk-to-reward ratio look like 1:5? Then price tapped your stop, reversed, and ran 80 pips in your direction without you on board?
That is the tight stop-loss trap. And it is one of the most common execution mistakes intermediate traders make.
Here is how it works. You spot a trade setup. You know where you want to enter and where you want price to go. But the structural stop loss, the one below the swing low or above the swing high, makes the R:R look mediocre. Maybe 1:1.5. Maybe 1:2 on a good day. So you cheat. You tighten the stop loss to make the numbers look better.
The problem is that you are not actually reducing risk. You are increasing the probability of getting stopped out. Your stop loss is sitting inside normal price noise instead of beyond a meaningful structural level. The trade idea was valid. Your stop placement just killed it.
Walkthrough: The Fake 1:5 That Cost $50
You are watching GBP/USD on the 1-hour chart. Price has pulled back to a demand zone near 1.2640. The nearest swing low sits at 1.2610, 30 pips below your entry. Your target is 1.2730, which is 90 pips above entry. That gives you a genuine R:R of 1:3 with a 30-pip stop.
But 1:3 does not feel exciting enough. So you tighten the stop to 12 pips, putting it at 1.2628, well above the swing low. Now the math says 1:7.5. Looks great on paper.
Price dips 18 pips during a London session liquidity sweep, hits your stop at 1.2628, and then rallies straight to 1.2735. You lost $60 on a 0.5-lot position (0.5 lots x $10/pip x 12 pips = $60) on a trade that would have netted $450 at the structural stop level (0.5 lots x $10/pip x 90 pips = $450). The trade idea was right. The stop placement was wrong.
This is the trap. You are not placing your stop loss where the trade becomes invalid. You are placing it where the R:R becomes flattering. Those are two completely different things.
Place the Stop Loss First, Then Calculate R:R
The fix is simple but requires discipline. Reverse the order of operations.
Step 1: Identify the structural invalidation point. Where does your trade idea break? For a long trade, that is usually the swing low beneath your entry zone. For a short, the swing high above it. That level is where you place the stop loss. Not 5 pips tighter. Not "close enough." At the level that actually invalidates the setup.
Step 2: Measure the distance. Count the pips between your entry and the structural stop. This is your R, the risk unit for this trade.
Step 3: Identify your target. Where is the next meaningful resistance (for longs) or support (for shorts)? This is your reward.
Step 4: Calculate R:R. Divide the reward distance by the risk distance. If the result is below 1:2, you do not take the trade. If it is 1:2 or above, the trade qualifies.
This order matters because it forces you to accept the trade's actual risk profile instead of inventing one. Your risk per trade percentage stays the same regardless. What changes is whether the trade deserves your capital.
Think of it like buying a used car. You do not set the price first and then find a car that matches. You find the car, inspect it, and then decide if the price is worth it. Same logic on a chart. The structure tells you the real cost of the trade. You decide if the payoff justifies it.
When to Skip a Trade Based on R:R
Skipping a trade feels wrong. You see a clean setup, the structure looks good, your bias is confirmed, but the R:R comes out to 1:1.3 after honest stop placement. Everything in your gut says take it.
Do not take it.
A trade with a structural stop loss and an R:R below 1:2 is a trade that does not pay you enough for the risk. Even with a 50% win rate, a 1:1 R:R system barely breaks even before commissions. At 1:1.3, you need to win roughly 44% of your trades just to stay flat. That is not a sustainable edge.
The minimum threshold is 1:2. At 1:2 R:R with a 40% win rate, you are still net positive over a large sample. And if you can hold out for 1:3 or better, even a 30% win rate keeps your account growing.
The Math on R:R and Win Rate
Here is what the numbers actually look like for a trader risking 0.5% per trade over 100 trades:
At 1:2 R:R with a 30% win rate: Average performance is roughly -4%. You lose money. Total loss risk is 32%.
At 1:5 R:R with a 30% win rate: Average performance is roughly +50%. Worst-case scenario is you still make about 5%. Total loss risk drops to 0.1%.
The gap between 1:2 and 1:5 is not a small improvement. It is the difference between a system that drains your account and one that grows it. But here is the important part: you cannot reach 1:5 by tightening your stop. You reach it by finding setups where the structural stop is naturally close to entry and the target is naturally far away.
Not every chart gives you that. When it does not, you sit on your hands. Trading rules exist for exactly this moment, when the right move is no move at all.
Walkthrough: Skipping a Valid Setup
EUR/USD, 4-hour chart. Price has formed a higher low at 1.0850 after a bullish impulse. The swing low beneath the HL sits at 1.0810, a 40-pip stop from your entry at 1.0850. The next resistance zone is at 1.0910, giving you a 60-pip target.
R:R = 60 / 40 = 1.5.
This is above 1:1 but below 1:2. The setup is valid. The structure is clean. But the trade does not qualify because the reward does not justify the risk. If you are risking 0.5% of a $10,000 account, that is $50 at risk for a potential $75 gain. Over 100 trades at a 35% win rate, this barely covers your losses. You skip this trade and wait for a setup where the structure offers 1:2 or better.
Two days later, price pulls back to 1.0830 and the same resistance target at 1.0910 is still valid. Now the stop is at 1.0805 (25 pips) and the target is 80 pips away. R:R = 80 / 25 = 1:3.2. This trade qualifies.
The second entry was better not because you tightened the stop. It was better because the market gave you a closer entry to structure. Patience did the work, not manipulation.
Structure-Based vs Emotion-Based Stop Placement
There are two ways traders place stops. One is based on price structure. The other is based on feelings. You can usually tell which one a trader used by looking at their trade journal.
Structure-based stop placement uses visible levels on the chart:
Swing lows and swing highs
The edge of a supply or demand zone
Below or above a key support or resistance level
Beyond a recent liquidity sweep
These levels have a reason behind them. If price breaks through a swing low on a long trade, the trade idea is genuinely invalid. The higher low you were trading from has been broken. The bullish structure is gone. Your stop was in the right place.
Emotion-based stop placement uses none of that. It uses feelings:
"I do not want to lose more than $20 on this trade" (arbitrary dollar cap)
"A 15-pip stop looks reasonable" (arbitrary pip count)
"If I put the stop here, I get a 1:4 R:R" (R:R-driven placement)
"The ATR is 25 pips so I will use a 25-pip stop" (indicator-driven without structural context)
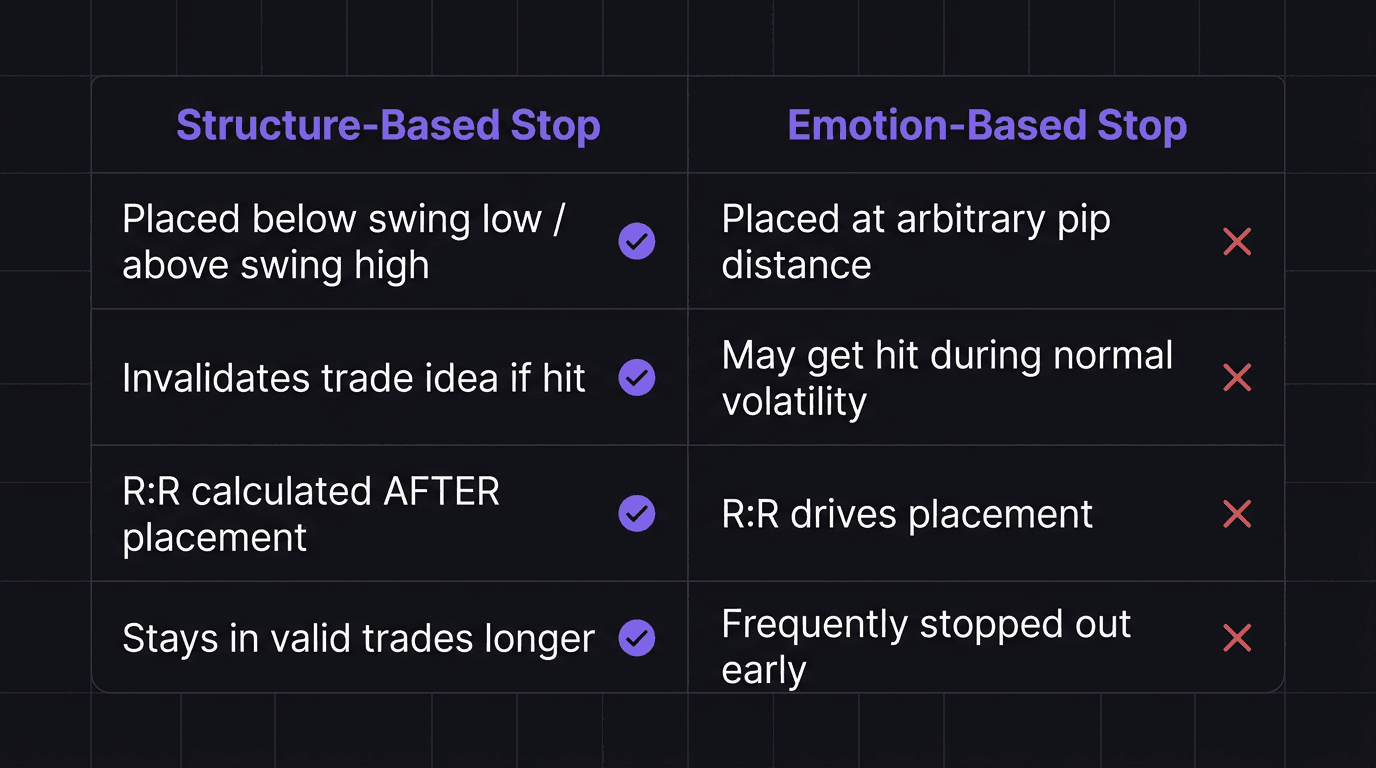
The difference matters because of what happens after you get stopped out. With a structural stop, getting stopped out means the trade idea was wrong. You can accept that and move on. With an emotional stop, getting stopped out often means the trade idea was right but your stop was in the wrong place. That is when FOMO trading kicks in. You re-enter the same trade without a plan because you "know" it is going to work, and you have already eaten one loss for it.
Structure-based stops also protect you from moving your stop loss in the wrong direction. When your stop sits at a meaningful level, there is no temptation to move it further away. The level either holds or it does not. When your stop is arbitrary, every tick against you feels like a reason to move it "just a little" to give the trade "more room."
Using ATR as a Structural Sanity Check
ATR (Average True Range) has a role in stop placement, but not as the sole driver. Use it as a filter, not a formula.
If the structural stop on EUR/USD is 15 pips below entry but the 14-period ATR reads 22 pips, your stop is inside one average candle range. Price can hit it without any structural break happening. In that case, either widen the stop to the next structural level beyond the ATR range, or skip the trade if the wider stop kills your R:R.
ATR tells you how much a pair typically moves. Structure tells you where the trade idea breaks. You need both, but structure leads.
How EdgeFlo Auto-Calculates Risk From Your Stop
All of this (measuring stop distance, calculating position sizing, checking if the R:R qualifies) is arithmetic. Important arithmetic, but arithmetic nonetheless. And arithmetic done under pressure in a live session is where mistakes happen.
EdgeFlo's auto risk calculator handles the mechanical part. You set your stop loss at the structural level. EdgeFlo reads the distance between your entry and your stop, applies your risk percentage (say 0.5% of your account), and calculates the correct lot size automatically. You do not need to pull up a pip calculator, figure out the pip value per lot, or do mental math while the candle is closing.
The calculation is always the same: risk amount divided by (stop distance in pips multiplied by pip value per lot) equals your lot size. EdgeFlo runs this every time you set a stop, so the position size matches your actual risk tolerance, not a guess.
This also means you can use your pre-trade checklist to confirm the R:R before execution. Set the stop at structure, let EdgeFlo calculate the lot size, check the R:R, and only proceed if the trade qualifies. The calculation removes one more opportunity for emotion to override process, and consistency comes from removing those opportunities one at a time.
The Edge Brief
Receive Insights on trading psychology, discipline, and the behavioral patterns that create consistent traders from our Founder and the EdgeFlo team, delivered to your inbox.
Think different. Trade different.
Where should I place my stop loss?
What is the minimum risk-to-reward ratio for a trade?
Should I tighten my stop loss to get a better R:R?
What does a structural stop loss mean?

Turn discipline on.
Every session.
EdgeFlo is the environment serious traders operate inside.
Start 7-Day Trial — $7
Cancel anytime.
No long-term commitment.


Think Different, Trade Different.