

Profit Taking Strategy for Forex Traders
Build a profit-taking system using fixed R targets and technical levels, then track and refine it in your trading journal.

You know when to enter. You know where your stop loss goes. But when price is running in your favor and your account is flashing green, a new question hits: when do you get out?
Take profit too early and you leave money on the table. Hold too long and you watch unrealized gains evaporate. The difference between a profitable trader and a breakeven trader often comes down to this single decision, and most traders make it based on gut feeling instead of a system.
TL;DR
Fixed R targets give you a simple, repeatable exit point based on multiples of your initial risk.
Technical targets use supply zones, demand zones, and swing points to exit where price is likely to reverse.
Combining both (partial at fixed R, remainder to technical level) balances certainty with upside.
Your trading journal is the only way to know which method actually works for your strategy.
Track exit data for at least 30 trades before changing your approach.
Fixed R Profit Targets
The simplest profit-taking system is the fixed R method. You decide before entering that you will exit at a specific multiple of your risk.
If you risk 30 pips with a $300 stop loss, a 3R target means you exit when you have gained 90 pips ($900). A 5R target means 150 pips ($1,500). The R multiple stays constant across every trade regardless of the pair, the setup, or market conditions.
This approach works because it removes the decision from the live trade. You are not staring at the chart asking, "Is this enough profit?" The plan already answered that question.
The transcript describes this as the "predetermined number of pips or R multiple" approach. "When price hits 3R, I will take partial profits and let the remaining run to plus 5R before I close the whole position."
When Fixed R Works Best
Fixed R targets shine when you trade the same setups repeatedly and need clean data. If every trade exits at 3R or -1R, your performance math is simple. Over 20 trades at 40% win rate: (8 x 3R) - (12 x 1R) = +12R. You can track your trading expectancy immediately.
Fixed R also prevents the "one more candle" trap. Without a hard exit level, winning trades tempt you to hold for just a bit more. Then one more candle. Then the trade reverses and your 3R winner becomes a 0.5R winner (or worse, a loss).
Technical Level Exits
The second approach uses the chart itself to determine where you take profit. Instead of a fixed multiple, you exit at a price level where you expect the market to reverse or stall.
Common technical exit points:
The next supply zone (for long trades) or demand zone (for shorts)
An unmitigated swing high or swing low
Equal highs or equal lows (liquidity zones)
A higher timeframe point of interest
The transcript explains: "When I buy at a demand zone, I am going to be taking profit at the next supply zone. Because I know for a fact that at the next supply zone, there is going to be some sort of sellers pushing the price down."
Walkthrough: EUR/USD Technical Exit
You enter long on EUR/USD at 1.0860 from a demand zone on the 4-hour chart. Your stop sits at 1.0830 (30 pips risk). The next unmitigated supply zone on the 4-hour sits at 1.0940.
That supply zone gives you an 80-pip target, roughly 2.67R. Not a round R number, but you are exiting where the market is likely to react, not at an arbitrary distance.
Price runs to 1.0935 and starts stalling. Sellers are stepping in near the supply zone. Price wicks to 1.0942, touching the zone, then closes a bearish candle at 1.0930. You exit at 1.0935 for +75 pips (2.5R).
Did you leave 5 pips on the table compared to the zone? Yes. But you exited based on structural evidence (seller response at supply), not based on an arbitrary number. If that supply zone held and price reversed 100 pips, you just saved yourself from watching a 2.5R winner turn into a loss.
The downside: technical exits vary in distance from trade to trade. One trade might be 2.5R, the next might be 4R, and the next might be 1.5R. This makes your data noisier than fixed R, which is why journaling is critical.
Combining Both Methods
The most versatile profit-taking strategy uses fixed R for the first exit and technical levels for the second. The transcript describes this exact combination: "I take partial profits when price actually hits plus 3R and I let the remaining run to the next higher time frame supply zone."
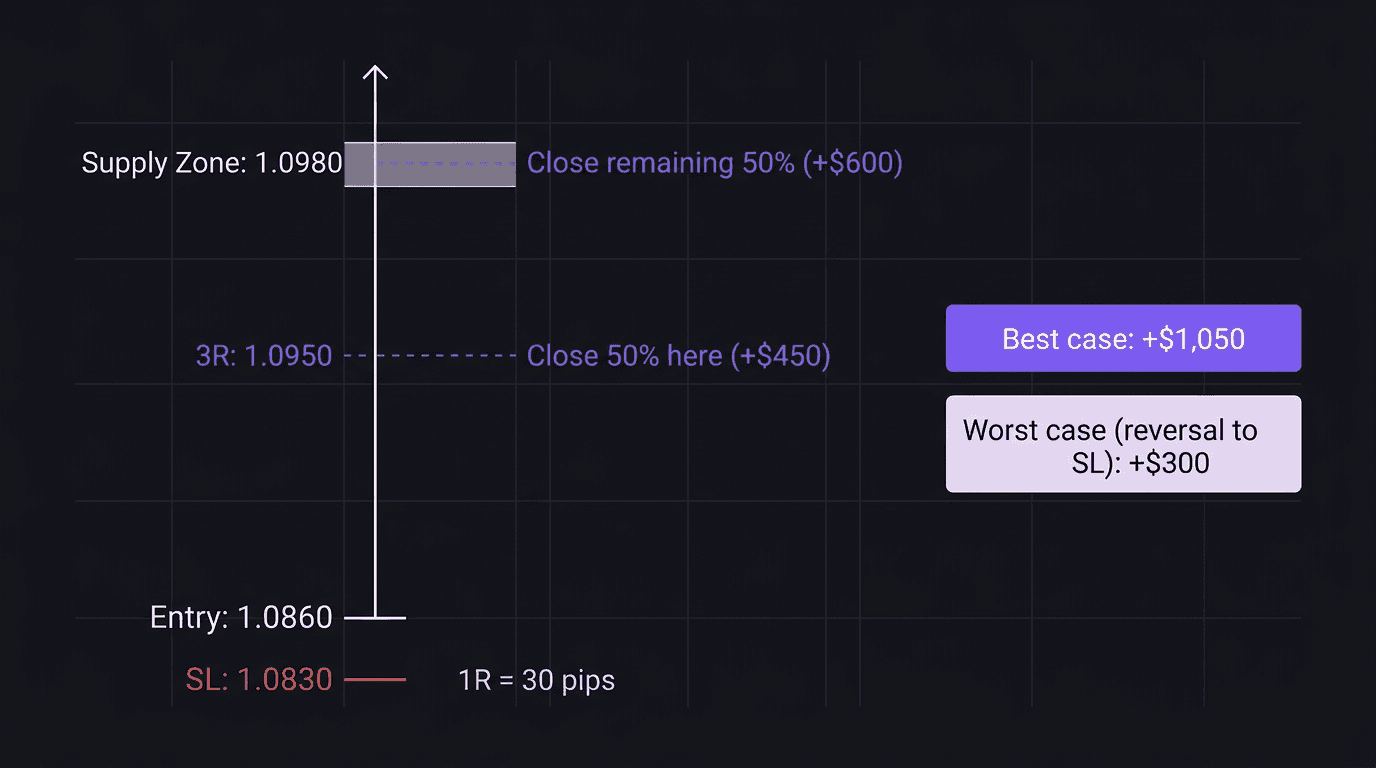
Here is how it works in practice. You enter EUR/USD long at 1.0860 with a 30-pip stop (1R = 30 pips = $300 at 1 standard lot). The next supply zone is at 1.0980 (120 pips, 4R away).
At 3R (1.0950), you close 50% of the position. That locks in $450 (half the position at 3R). The remaining 50% runs toward the supply zone at 1.0980.
Best case: the remaining 50% hits 1.0980 for +4R on that half. Total: $450 + $600 = $1,050.
Worst case: price reverses from 3R and hits your original stop at 1.0830. You lose $150 on the remaining 50% (0.5 lots x 30 pips x $10/pip), but you already banked $450. Net result: +$300. You still profit even though your stop got hit.
This is what the transcript calls "remove risk while maintaining unlimited upside." By paying yourself at the fixed R level, the remaining position becomes essentially risk-free.
Track and Refine in Your Journal
A profit-taking strategy only works if you actually know whether it is working. That requires data, and data requires a trading journal.
For every trade, record these exit-specific fields:
Planned exit level (where you intended to take profit)
Actual exit level (where you actually closed)
Price after exit (where did price go after you got out?)
R captured (your actual R on the trade)
R available (the max R the trade offered before reversing)
The gap between "R captured" and "R available" tells you everything. If you consistently capture 2R but the trades regularly offer 4R before reversing, your exits are too tight. If you hold for 4R but trades usually reverse at 2.5R, your targets are too ambitious.
Run this analysis in your trading review after every 20 to 30 trades. Look at your average R captured versus average R available. That ratio is your exit efficiency.
A post-trade review immediately after each trade captures the freshest data. Write down what you felt at the exit point. Were you relieved? Greedy? Scared? Mapping emotions to exits reveals patterns that pure numbers miss.
Over time, your equity curve will show whether your profit-taking rules are working. A rising curve with consistent R captures means your system is sound. A flat or declining curve after 50+ trades means something needs adjusting.
How EdgeFlo Supports Profit Tracking
EdgeFlo's journal auto-imports your trades, which means your entry, exit, and R data are already captured without manual input. You can tag each exit with the method you used (fixed R, technical, or combined) and filter your review by exit type.
This makes the comparison straightforward. Pull up 30 trades where you used fixed 3R exits and compare average R and profit factor against 30 trades where you used technical exits. The numbers tell you which approach fits your strategy better.
The Edge Brief
Receive Insights on trading psychology, discipline, and the behavioral patterns that create consistent traders from our Founder and the EdgeFlo team, delivered to your inbox.
Think different. Trade different.
What is a fixed R profit target?
Should I take profits at technical levels or fixed R?
How do I know if I am taking profits too early?
Can I combine fixed R with technical exits?

Turn discipline on.
Every session.
EdgeFlo is the environment serious traders operate inside.
Start 7-Day Trial — $7
Cancel anytime.
No long-term commitment.


Think Different, Trade Different.