

Point of Interest: Where Institutions Enter
A point of interest marks where institutions placed large orders. Learn how to identify these zones and why they matter more than support and resistance.

A point of interest in trading is the price zone where institutions placed large orders that caused the next major move. It is not a line on a chart. It is the origin of momentum, the spot where big money entered, and the spot where they are likely to add to their position when price returns.
If you have been using support and resistance levels and keep getting stopped out right before price moves in your direction, this is why. Support and resistance levels are visible to everyone, which makes them targets for liquidity sweeps, not reliable entry zones.
TL;DR
A point of interest (POI) marks where institutional orders created an impulse move that broke structure.
Support and resistance lines are prone to manipulation because every retail trader sees the same levels.
To find a POI, locate the consolidation or pivot candle before a strong impulse move that takes out a swing high or low.
Higher timeframe POIs carry more weight than lower timeframe ones.
Combining a POI with market structure direction gives you the "right place" half of timing your entries.
Why Support and Resistance Gets You Stopped Out
Picture this. EUR/USD is in an uptrend on the 4-hour chart. Price pulls back to a level that looks like obvious support. You enter a buy, place your stop loss just below the line, and wait.
Price dips below the support level by 8 pips, triggers your stop loss, then immediately rockets upward. You were right about the direction. You were wrong about the level. That 8-pip wick below support was not random. It was a liquidity sweep.
Here is the problem with support and resistance: because every retail trader draws the same horizontal lines, every retail trader places their stop losses in the same cluster below those lines. That cluster of stop losses is fuel. When institutional traders want to enter a large buy position, they need someone to sell to them. Your stop loss, when triggered, is a sell order. Hundreds of retail stop losses getting triggered at once gives institutions the liquidity they need to fill their massive buy orders.
This is not conspiracy. It is market mechanics. Large orders need counterparty volume, and retail stop clusters provide it.
Walkthrough: Getting Hunted at Support
A trader draws support at 1.0850 on EUR/USD. Price has bounced there twice before, so it looks solid. She enters a buy at 1.0855 and places her stop loss at 1.0840 (10 pips below support). Risk is 0.5 standard lots, so 10 pips equals $50 at risk.
Price drops to 1.0835, sweeping below support by 15 pips. Her stop triggers. She takes a $75 loss (15 pips times $5 per pip at 0.5 lots). Fifteen minutes later, price reverses from 1.0830 and rallies to 1.0920.
She was right about direction but wrong about where institutions were actually positioned. A POI drawn at the origin of the previous impulse move would have placed her entry lower (near 1.0830), with a tighter stop below the true institutional zone.
What Makes a Point of Interest Different
A point of interest is not a line. It is a zone, and specifically, it is the origin zone of an impulse move that broke structure.
Think about what has to happen for price to take out a swing high. That requires a lot of buying pressure. Retail traders alone do not generate that kind of momentum. When you see a strong impulse candle that breaks a previous high, institutions entered at the base of that move. They placed large buy orders in the consolidation before the breakout.
That consolidation is your point of interest. When price returns to that zone later, those same institutions (or new ones seeing the same footprint) are likely to enter again. They are scaling into an existing position or opening a new one at the same proven price level.
This is fundamentally different from drawing a horizontal line at a swing low and calling it support. The POI approach asks: where did the big money actually enter? Not: where did price bounce visually?
How to Identify a Point of Interest
Finding a POI follows a simple process tied to supply and demand zones.
Step 1: Establish trend direction on the higher timeframe. Open your 4-hour or daily chart. Is price making higher highs and higher lows (uptrend) or lower highs and lower lows (downtrend)? If you cannot tell, price is ranging, and POIs are less reliable.
Step 2: Find the impulse move that broke structure. In an uptrend, look for the candle or candles that pushed price above the previous swing high. In a downtrend, find the move that broke below the previous swing low. The impulse is the proof that institutional money was involved.
Step 3: Trace the impulse back to its origin. The consolidation or pullback immediately before that impulse is your POI. This is where institutions loaded their orders before pressing the button.
Step 4: Draw the zone. You have two methods for this:
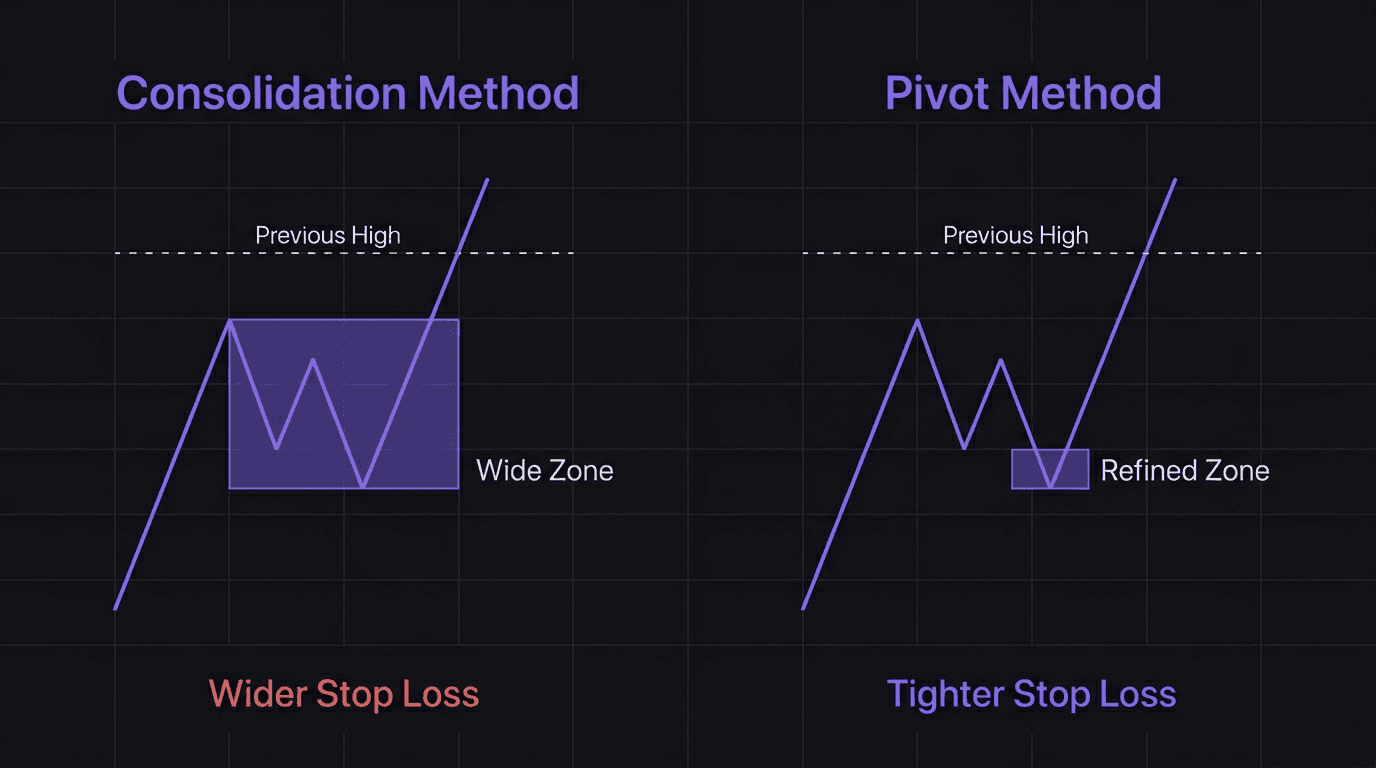
Consolidation method: Draw a rectangle from the high to the low of the entire pullback. This gives a wider zone with more room for error.
Pivot method: Find the single candle at the very bottom (for demand) or top (for supply) of the pullback. Draw the zone from that candle's high to its low. This gives a tighter, more refined zone.
The pivot method gives you a smaller stop loss and better risk to reward. The consolidation method gives you more room but a wider stop. Both are valid. The key is consistency: pick one method and backtest it before trading it live.
Multi-Timeframe POI Usage
Not all POIs are equal. A demand zone on the 5-minute chart carries far less weight than one on the 4-hour chart. The reason is volume. A 4-hour impulse that breaks a swing high represents hours of institutional accumulation. A 5-minute impulse might just be a news spike.
The practical framework for day traders:
4-hour chart: Identify trend direction and mark major POIs. These are your "where should price go" zones.
1-hour chart: Mark secondary POIs within the 4-hour structure. These give you more precise areas to watch.
15-minute chart: Look for entry confirmation when price reaches a 1-hour or 4-hour POI. This is where you wait for a market structure shift before pulling the trigger.
You do not go down to the lower timeframe until price reaches your higher timeframe POI. If price is still traveling toward your zone, there is nothing to do on the 15-minute chart. Patience here is not optional. Being early is just as bad as being wrong.
Walkthrough: Using a 4-Hour POI for a Day Trade
GBP/USD is in an uptrend on the 4-hour chart: higher highs and higher lows. Price just made a new high at 1.2750 and starts pulling back. You trace the impulse that broke 1.2700 (the previous swing high) back to its origin. The pullback before that impulse consolidated between 1.2640 and 1.2660.
Using the pivot method, you mark the origin candle zone at 1.2640 to 1.2650. You wait.
Price drops to 1.2645, entering your zone. You switch to the 15-minute chart and wait for the internal structure to shift bullish (price breaks above the last lower high on the 15-minute). Once that happens, you enter a buy at 1.2655 with a stop loss at 1.2635, risking 20 pips.
At 0.5 standard lots on GBP/USD ($10 per pip per standard lot), 0.5 lots gives you $5 per pip. Risk is 20 pips times $5, which is $100. Take profit at 1.2735 (targeting the previous high area), which is 80 pips. Reward is 80 pips times $5, which is $400. That is a 4R trade.
When a POI Fails
POIs are not magic. They fail when the trend reverses.
If price is in an uptrend and returns to a demand POI, you expect a bounce. But if price breaks through the POI and closes below it with conviction, the trend structure is broken. The last higher low has been violated, which means the uptrend is over and price is now shifting into a downtrend.
When a POI fails, do not add to the position. Do not move your stop. Accept the loss as data. The POI did its job by giving you a defined zone with a clear invalidation point. If price breaks through, you know the thesis was wrong, and you know exactly how much you lost. That clarity is the entire advantage of trading zones instead of horizontal lines.
How EdgeFlo Helps You Trade Points of Interest
EdgeFlo's Edge feature lets you define, document, and store your POI criteria as part of your trading plan. Instead of reinventing your zone-drawing rules each session, you write them once and keep them visible beside your chart.
After each trade at a POI (win or loss), EdgeFlo's journal captures the setup so you can review whether your zones are working over time. Patterns emerge in the data: maybe your 4-hour POIs hit at a 65% rate but your 1-hour POIs only hit at 40%. That kind of feedback turns POI trading from feel-based discretion into a measurable process you can actually improve.
What is a point of interest in trading?
How is a point of interest different from support and resistance?
How do you find a point of interest on a chart?
Do points of interest work on all timeframes?

Turn discipline on.
Every session.
EdgeFlo is the environment serious traders operate inside.
Start 7-Day Trial — $7
Cancel anytime.
No long-term commitment.


Think Different, Trade Different.