

Multi Timeframe Analysis: Align Structure
Learn how to combine swing, internal, and fractal structure across timeframes. Find high-probability setups where all three layers align.

Multi timeframe analysis is the process of reading three layers of market structure, swing, internal, and fractal, across different chart timeframes to find trades where all layers agree on direction. When all three are aligned, you have the highest probability setup. When they conflict, you wait.
That is the entire concept in two sentences. The execution, however, requires knowing exactly what each layer tells you and how to read alignment versus conflict. Most traders check multiple timeframes but never define what they are actually looking for on each one. That is where setups fall apart.
TL;DR
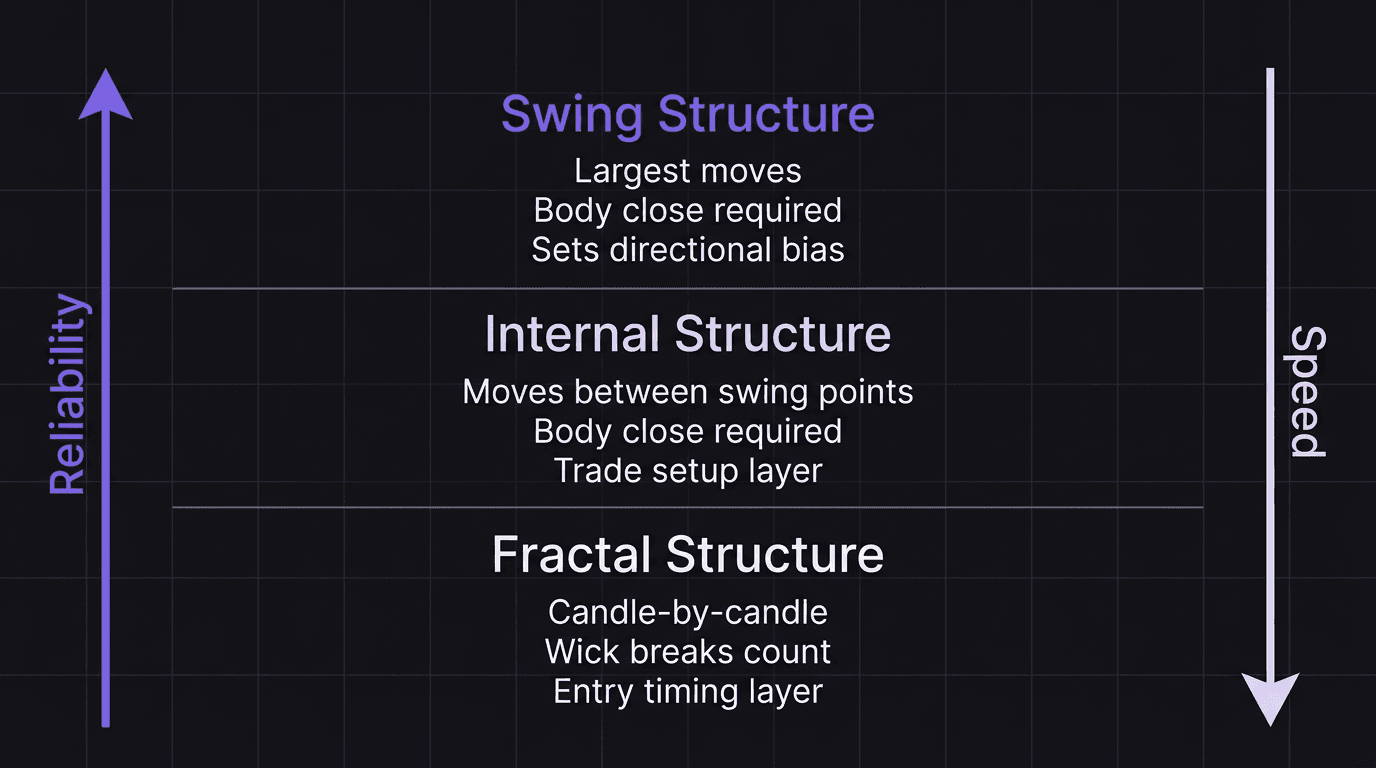
Multi timeframe analysis maps three structure layers: swing (largest moves), internal (moves between swing points), and fractal (candle-by-candle).
Highest probability setups occur when swing and internal structure are both bullish or both bearish.
Swing structure sets your daily bias. Internal structure gives you the trade setup. Fractal structure times your entry.
A fractal shift is an early warning, not a reversal confirmation. Do not trade it alone.
When layers conflict, the correct action is to wait, not force a trade.
What Is Multi Timeframe Analysis
Most traders think multi timeframe analysis means checking the daily chart for trend, then dropping to the 15-minute for an entry. That is oversimplified. You end up with a vague sense of direction on the higher timeframe and no structured way to connect it to your execution timeframe.
Real multi timeframe analysis maps market structure at three distinct levels, each with its own rules, and then checks whether those levels agree.
Here is what each layer does:
Swing structure captures the largest moves on your chart. Higher highs and higher lows in a bullish swing structure. Lower highs and lower lows in a bearish one. Swing points are the anchor levels. Breaking one with a body close is a major structural event. This layer tells you the dominant trend.
Internal structure is everything happening between two swing points. After price makes a swing high, it pulls back toward the swing low. During that pullback, internal structure maps the smaller moves. Internal BOS and MSS also require body closes. This layer tells you whether the pullback is orderly or turning into something bigger.
Fractal structure is candle-by-candle movement, the most granular view. It uses wick breaks (not body closes) because at this scale, waiting for body confirmation filters too much. Fractal shifts are the first early signal that a move might be starting. This layer gives you precision on timing.
Each layer has its own confirmation rules. Mixing them up is one of the fastest ways to take bad trades.
Three Layers of Structure
Understanding each layer in isolation is straightforward. The skill is in how they interact.
Swing Structure (The Big Picture)
Swing structure is your directional anchor. On a 4-hour chart, swing highs and swing lows form over days. A bullish swing structure means you are biased long. A bearish swing structure means you are biased short.
Swing BOS requires a body close. If price wicks through a swing high but closes below it, the swing structure is intact. No break.
The swing structure also defines your premium and discount zones. The range between the most recent swing high and swing low is your playground. Above the 50% midpoint is premium. Below is discount. You want to buy in discount and sell in premium.
Internal Structure (The Setup Layer)
Once you know the swing direction, internal structure shows you the path price takes between swing points. After a bullish swing BOS, price does not go straight up. It pulls back. During that pullback, internal structure creates its own highs and lows.
An internal market structure shift (MSS) confirms that the pullback is underway. This is where your trade setup forms. If swing structure is bullish and internal structure shifts bearish (pullback), you wait for internal structure to shift back bullish (pullback over, continuation).
That realignment is your entry signal.
Fractal Structure (The Timing Layer)
Fractal structure moves fast. It shifts direction multiple times within a single internal move. A fractal market shift is the first sign that an internal pullback might be starting. It is not confirmation. It is an alert.
Use fractal structure for entry timing only, never for directional bias. A fractal bullish shift inside a bearish internal move inside a bearish swing structure is not a buy signal. It is noise.
How to Align Timeframes
Here is the mechanical process. No guessing involved.
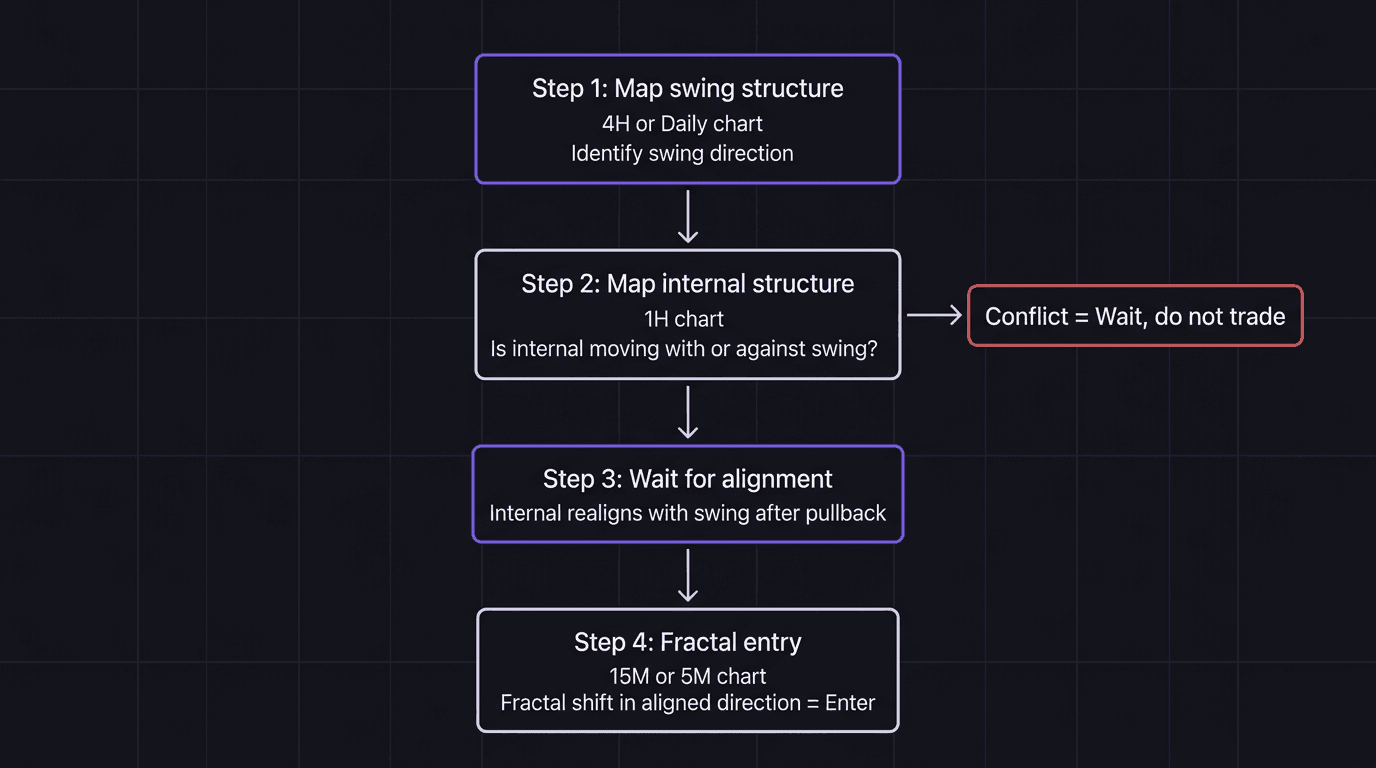
Step 1: Map swing structure on your higher timeframe. Open your 4-hour or daily chart. Identify the current swing direction. Mark the most recent strong swing high and strong swing low. This gives you your daily bias.
Step 2: Drop to your middle timeframe and map internal structure. On the 1-hour chart, look at what is happening between those 4-hour swing points. Is internal structure moving with the swing trend, or pulling back against it?
Step 3: Wait for alignment. The highest probability setup forms when internal structure realigns with swing structure after a pullback. If swing is bullish and internal just shifted bullish again after a pullback, that is your green light.
Step 4: Use fractal structure on your entry timeframe for precision. Drop to the 15-minute or 5-minute chart. Look for a fractal shift in the direction of your aligned swing and internal structure. This is your entry trigger.
Walkthrough: Aligned Setup on EUR/USD
You are trading EUR/USD during a London kill zone session.
4-hour chart (swing): Bullish. Price made a higher high at 1.0960 and the most recent higher low is at 1.0820. Swing structure is clearly bullish.
1-hour chart (internal): After hitting 1.0960, price pulls back. Internal structure shifts bearish on the 1-hour as price makes lower highs and lower lows back toward the 1.0850 area (discount zone). Then a 1-hour candle closes its body above the most recent internal swing high at 1.0875. Internal MSS to the upside. Internal and swing are now both bullish.
15-minute chart (fractal): You see a fractal bullish shift on the 15-minute as price breaks a minor high at 1.0880 with a wick (fractal rules). This is your entry.
You enter long at 1.0882 with a stop below the internal swing low at 1.0845 (37 pips risk). Your target is a retest of the swing high at 1.0960 (78 pips target). Risk to reward: 2.1R.
All three layers agreed: swing bullish, internal bullish (after realignment), fractal bullish. That is the setup.
When Alignment Fails
Not every session gives you alignment. When the layers conflict, the answer is simple: do nothing.
Scenario 1: Swing bullish, internal bearish. Price is pulling back. The internal move against the swing trend is not your enemy. It is creating the next buying opportunity. But you do not buy until internal structure realigns bullish. Trading the internal bearish move against the swing trend is possible but low probability.
Scenario 2: Internal bullish, swing undecided. Sometimes swing structure is in transition. The previous swing low has been broken but a new directional sequence has not formed. If you cannot clearly define swing structure, step back and wait. Forcing a bias on unclear structure is gambling.
Scenario 3: Fractal shift without internal confirmation. This is the most common trap. You see a fractal bullish shift and jump in, but internal structure is still bearish and swing structure is also bearish. That fractal shift was just a minor bounce inside a larger move down. Without internal confirmation, fractal shifts are noise.
Walkthrough: Misalignment Trap on GBP/USD
GBP/USD, 1-hour chart. Swing structure is bearish (lower highs, lower lows on the 4-hour). Internal structure is also bearish on the 1-hour. Price has been grinding down.
On the 15-minute chart, you see a fractal bullish shift. Price breaks a minor high with a wick. It looks like a reversal might be forming.
You enter long at 1.2660 with a stop at 1.2640 (20 pips). Price moves up to 1.2675, and then sells off hard. The internal structure never shifted bullish. The swing structure was still bearish. The fractal shift was a liquidity sweep, not a reversal.
You lose 20 pips. The lesson: fractal alone is never enough. Wait for internal to confirm.
The temptation to trade fractal shifts in isolation is real, especially during slow sessions when you want something to happen. But the data is clear. Backtesting this rule shows that fractal-only entries without internal alignment lose more often than they win.
How EdgeFlo Helps You Track Structure Alignment
Keeping three layers of structure straight in your head during a live session is harder than it sounds. Your bias shifts, you forget which timeframe showed the MSS, and suddenly you are second-guessing your read. EdgeFlo's trade plan builder (Edge) lets you document your multi timeframe checklist before the session starts. Your swing bias, internal trigger, and fractal entry rules stay visible on screen while you trade.
After the session, EdgeFlo's journal captures every trade. You can tag entries where all three layers aligned versus entries where you jumped on fractal alone. Over weeks, the win rate difference between aligned and misaligned trades becomes obvious in your analytics dashboard.
The structure alignment process is 100% mechanical. But executing it consistently requires an environment that keeps the rules in front of you. That is what EdgeFlo is built for.
The Edge Brief
Receive Insights on trading psychology, discipline, and the behavioral patterns that create consistent traders from our Founder and the EdgeFlo team, delivered to your inbox.
Think different. Trade different.
How many timeframes should I use for multi timeframe analysis?
What happens when swing and internal structure conflict?
Is multi timeframe analysis the same as top-down analysis?
Can you use multi timeframe analysis for scalping?

Turn discipline on.
Every session.
EdgeFlo is the environment serious traders operate inside.
Start 7-Day Trial — $7
Cancel anytime.
No long-term commitment.


Think Different, Trade Different.