

Multi-Timeframe Analysis: How to Read the Market on Two Levels
Learn multi-timeframe analysis for trading. Use the higher timeframe for direction and the lower timeframe for entries to find high-probability setups.

You found a clean demand zone on the 15-minute chart. Price pulls back, you enter, and it drops straight through your level. What happened? The 4-hour chart was in a clear downtrend, and your 15-minute demand zone sat directly under a higher-timeframe supply zone. One timeframe told you to buy. The other was screaming sell.
Multi-timeframe analysis solves this problem. You read direction on the higher timeframe and find entries on the lower timeframe. The higher chart sets the bias. The lower chart sets the trade. When both align, probability stacks in your favor.
TL;DR
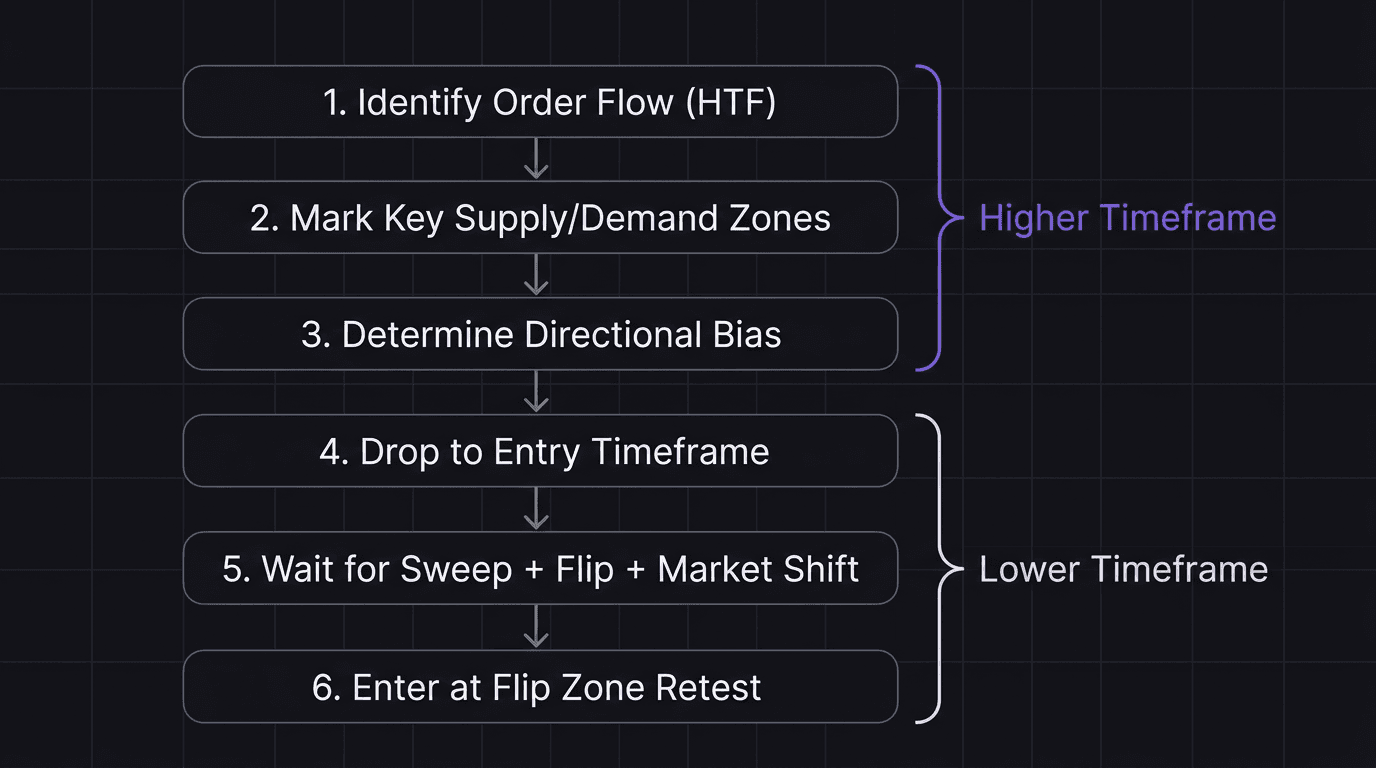
Use the higher timeframe to identify trend direction and key zones.
Drop to the lower timeframe only after the higher timeframe gives you a directional bias.
Match your timeframe pairing to your trading style (scalper, day trader, swing trader).
The same market structure patterns repeat across every timeframe because markets are fractal.
Never take a lower-timeframe entry that fights the higher-timeframe order flow.
Why One Timeframe Is Never Enough
A single chart gives you half the picture. Zoom in too much and you lose the trend. Zoom out too far and you miss the entry.
Think of it like reading a map. The country-level view tells you which direction to drive. The street-level view tells you where to turn. You need both, and you read them in that order.
On a 15-minute chart, a bullish flip zone might look perfect. But if the 4-hour chart shows price just tapped into a strong supply zone, that 15-minute buy is fighting the current. The higher timeframe context reveals whether your lower-timeframe setup has room to run, or is about to get rejected.
This is the core principle: the higher timeframe decides if you should trade at all. The lower timeframe decides where and when.
The Higher Timeframe Sets Direction
Your higher timeframe job is simple. Identify three things:
Order flow. Is price making higher highs and higher lows (bullish) or lower highs and lower lows (bearish)?
Key zones. Where are the supply and demand zones that matter? Mark the unmitigated ones.
Reaction points. Has price reacted from a zone and created a flip? If a supply zone failed and price formed a higher low, that supply just became demand.
Once you have these three things marked, you know your daily bias. If the 4-hour chart shows bullish order flow with price pulling back toward a demand zone, your bias is long. You only look for buys on the lower timeframe.
The higher timeframe also tells you where to take profit. After a bullish flip, the next target is usually the previous swing high or the nearest unmitigated supply zone above. Mark that level before you drop down. It becomes your exit.
The Lower Timeframe Sets Entry
Here is where it gets precise. Once the higher timeframe gives you a bias and a zone, you drop to the entry timeframe and wait for confirmation.
What you are looking for on the lower timeframe is the exact same structure you see on the higher timeframe. Markets are fractal. The same pattern of sweep, flip, and market shift plays out on the 1-minute chart the same way it plays out on the 4-hour chart.
The entry process on the lower timeframe follows these steps:
Price approaches the higher-timeframe zone.
On the lower timeframe, watch for price to create a bearish structure (lower highs, lower lows) into the zone.
Wait for a failed reaction. The supply that was pushing price down fails. Price prints a higher low.
That failed reaction creates a flip zone.
A market structure shift confirms the flip. Price breaks above the last lower high.
When price pulls back to the flip zone, that is your entry.
Stop-loss goes below the structure that created the flip.
Walkthrough: EUR/USD 4-Hour to 15-Minute Entry
The 4-hour chart shows EUR/USD in a downtrend with lower highs and lower lows. Price hits 1.0820 and reacts sharply, forming a higher low at 1.0835 instead of continuing down. The supply zone at 1.0870 (where the last lower high formed) has just failed. Order flow flips to bullish.
You mark the flip zone between 1.0835 and 1.0845. The next unmitigated supply zone sits at 1.0920, which becomes your target area.
You drop to the 15-minute chart. Price rallies to 1.0875, then starts pulling back toward your 4-hour flip zone. On the 15-minute, the pullback creates lower highs and lower lows into the zone. Price reaches 1.0842, sweeps below 1.0840 briefly, then pushes back up and breaks above the last 15-minute lower high at 1.0858.
That break is your market structure shift. The flip zone on the 15-minute sits at 1.0845. You enter long at 1.0845 when price retests, with a stop-loss at 1.0830 (below the sweep low) and a target at 1.0920.
That gives you a 15-pip stop and a 75-pip target, which is a 5:1 risk-to-reward ratio. On 0.5 lots ($5 per pip), your risk is $75 and your potential reward is $375.
Timeframe Pairing for Your Style
The entry model works the same way regardless of your trading style. What changes is which timeframes you pair together.
Trading Style | Higher Timeframe | Entry Timeframe |
|---|---|---|
Scalper | 4-hour or 1-hour | 5-minute or 1-minute |
Day Trader | Daily or 4-hour | 15-minute |
Swing Trader | Weekly | 1-hour or 4-hour |
A scalper reading structure on the 4-hour chart and entering on the 1-minute chart will see the same flip zone and market shift patterns as a swing trader reading the weekly and entering on the 1-hour. The fractal nature of price means the structure repeats at every scale.
The key is picking timeframes that match your schedule and personality, then sticking with them. Switching timeframes day to day breaks your pattern recognition. You need repetition on the same two charts to build consistency.
If you are not sure where to start, the 4-hour to 15-minute pairing works for most traders. It gives enough context on the higher timeframe without requiring all-day screen time, and the 15-minute chart moves fast enough to provide clean entries without the noise of the 1-minute.
Use backtesting to verify your timeframe pairing works with your strategy. Run at least 50 trades on the pairing before going live. If the patterns you expect to see on the lower timeframe do not show up consistently, widen the gap between your two timeframes.
Walkthrough: Wrong Timeframe Pairing
A day trader uses the daily chart for multi-timeframe analysis but tries to enter on the 1-minute chart. The daily chart shows a demand zone at 1.2500 on GBP/USD. Price reaches the zone on Tuesday morning.
On the 1-minute chart, the trader sees what looks like a flip zone and enters long. But the daily demand zone spans 50 pips (1.2480 to 1.2530). On the 1-minute chart, price has only touched the top of the zone. It continues dropping for another 30 pips, stopping the trader out, before finally reacting from the bottom of the daily zone on Wednesday.
The problem: the gap between the daily and 1-minute is too wide. Daily zones create 30 to 80 pip ranges. The 1-minute chart cannot distinguish where within that range the real reaction will happen. A 15-minute or even 5-minute entry timeframe would have filtered the noise and waited for the actual reaction before confirming an entry.
The pre-trade checklist should include verifying timeframe alignment before every trade. If your higher-timeframe zone is wide and your entry timeframe is too small, the setup does not qualify.
How EdgeFlo Documents Your Timeframe Rules
Keeping your timeframe pairing consistent is harder than it sounds. After a losing streak on the 4-hour to 15-minute setup, the urge to switch to the 1-hour to 5-minute "for better entries" is strong. That is how you lose your edge.
EdgeFlo's Edge plan builder lets you document your timeframe pairing as part of your written trading plan. You define which higher timeframe sets your bias and which lower timeframe triggers your entries. That plan stays visible during your session, so when the temptation to switch hits, your rules are right there on screen.
After each trade, you can self-report whether you followed your timeframe rules. Over time, you build a clear record of whether your timeframe-aligned trades outperform the ones where you improvised. That data makes the decision for you.
What is multi-timeframe analysis in trading?
What timeframes should I pair for day trading?
Why is one timeframe not enough for trading?
Does multi-timeframe analysis work for scalping?

Turn discipline on.
Every session.
EdgeFlo is the environment serious traders operate inside.
Start 7-Day Trial — $7
Cancel anytime.
No long-term commitment.


Think Different, Trade Different.