

Measure Trading Progress Without Fixating on P&L
Stop measuring trading progress by monthly P&L. Use process metrics and quarterly windows to track real improvement that the market cannot fake.

If you measure trading progress by your monthly P&L, you will make bad decisions. A profitable month makes you think you have figured it out. A losing month makes you want to switch strategies. Both reactions are wrong because monthly P&L is mostly noise for traders with small sample sizes.
The traders who actually improve measure progress with process metrics and use quarterly windows to evaluate real trends. P&L eventually follows. But it follows skill, not the other way around.
TL;DR
Monthly P&L is too noisy to measure progress. You can lose for 3 months while executing a profitable strategy perfectly.
Process metrics (plan adherence, average R, grade distribution) measure what you control.
Use quarterly windows of 50 to 100 trades to evaluate whether you are improving.
Real progress looks like higher plan adherence and more stable R, not a bigger monthly number.
P&L is a by-product of process improvement, not a target to chase directly.
Why P&L Is a Bad Progress Metric
Imagine you follow your plan on every trade this month. Your setup has a 35% win rate with a 3:1 reward-to-risk ratio. Over 20 trades, probability says you should win about 7 and lose about 13.
But this month, you win 5 and lose 15. You are down. Does that mean you got worse as a trader?
No. You executed the same plan at the same quality. The distribution of wins and losses just landed unfavorably this month. Over 100 trades, the numbers will normalize. But over 20, anything can happen.
This is why fixating on monthly P&L is destructive. It makes you feel like a failure during normal variance. And worse, it makes you feel like a genius during lucky streaks, right before you blow up your risk management.
The best traders in the world have losing months. Some have losing quarters. The difference is that they measure themselves on execution quality, not on whether the coin flipped their way 20 times in a row.
Walkthrough: Same Execution, Different P&L
A trader runs the same strategy for two consecutive months on EUR/USD, risking 1% per trade ($100 per trade on a $10,000 account).
Month 1: 18 trades. 8 wins at average 2.5R, 10 losses at 1R. - 8 wins x 2.5R x $100 = $2,000 gained. - 10 losses x 1R x $100 = $1,000 lost. - Net: +$1,000. Plan adherence: 89%.
Math check: - 8 wins x 2.5 x $100 = $2,000. - 10 losses x 1 x $100 = $1,000. - $2,000 minus $1,000 = +$1,000.
Month 2: 20 trades. 5 wins at average 2.5R, 15 losses at 1R. - 5 wins x 2.5R x $100 = $1,250 gained. - 15 losses x 1R x $100 = $1,500 lost. - Net: -$250. Plan adherence: 90%.
Math check: - 5 wins x 2.5 x $100 = $1,250. - 15 losses x 1 x $100 = $1,500. - $1,250 minus $1,500 = -$250.
The trader's execution actually improved slightly from Month 1 to Month 2 (89% to 90% adherence). But the P&L went from +$1,000 to -$250 purely because win distribution shifted. If the trader uses P&L as the progress metric, Month 2 looks like regression. It is not.
Process Metrics That Show Real Improvement
These are the numbers that measure you, not the market. Track them in your trading dashboard or journal.
Plan Adherence Rate
The percentage of trades where you followed every rule. This is the single best measure of execution quality. If your adherence moves from 65% in January to 80% in March, you are improving regardless of what your P&L says.
Average R Per Trade
Take your total R gained (or lost) and divide by total trades. This tells you the average outcome per trade in risk units.
If your average R is positive and stable, your strategy has an edge and you are capturing it. If it is volatile or trending down while your plan adherence is high, the strategy itself might need review.
Grade Distribution
The ratio of A, B, and C trades (graded on execution quality, not outcome). A rising A-grade percentage means you are executing better. A rising C-grade percentage means you are drifting.
This metric catches discipline problems weeks before they show up in P&L.
Journal Consistency
Are you logging every trade? Every day? If you logged 95% of trades in January and only 70% in March, you are losing data. Incomplete data means incomplete reviews. Track your logging rate alongside your trading metrics.
Missed Setup Rate
The percentage of valid setups you identified but did not take. High miss rates indicate hesitation, timing problems, or confidence issues. If you are consistently missing 40% of valid setups, your performance review needs to investigate why.
Quarterly Measurement Windows
Monthly is too short. Annual is too long for feedback. Quarterly gives you the right balance: enough trades to see real patterns, frequent enough to make adjustments.
A quarter typically produces 50 to 100 trades for an active day trader. That is enough to calculate meaningful statistics.
At the end of each quarter, answer these questions:
Is my plan adherence rate higher than last quarter? If yes, you are improving your execution.
Is my average R stable or improving? If yes, your strategy is capturing its edge.
Has my grade distribution shifted toward more A-grades? If yes, your discipline is improving.
Are there C-grade behaviors I eliminated this quarter? Name them specifically.
What is the one C-grade behavior I will target next quarter?
Notice that none of these questions ask "Did I make money?" The P&L appears in your equity curve, and you should look at it. But the progress evaluation is based on process metrics, not dollars.
Walkthrough: A Quarterly Progress Check
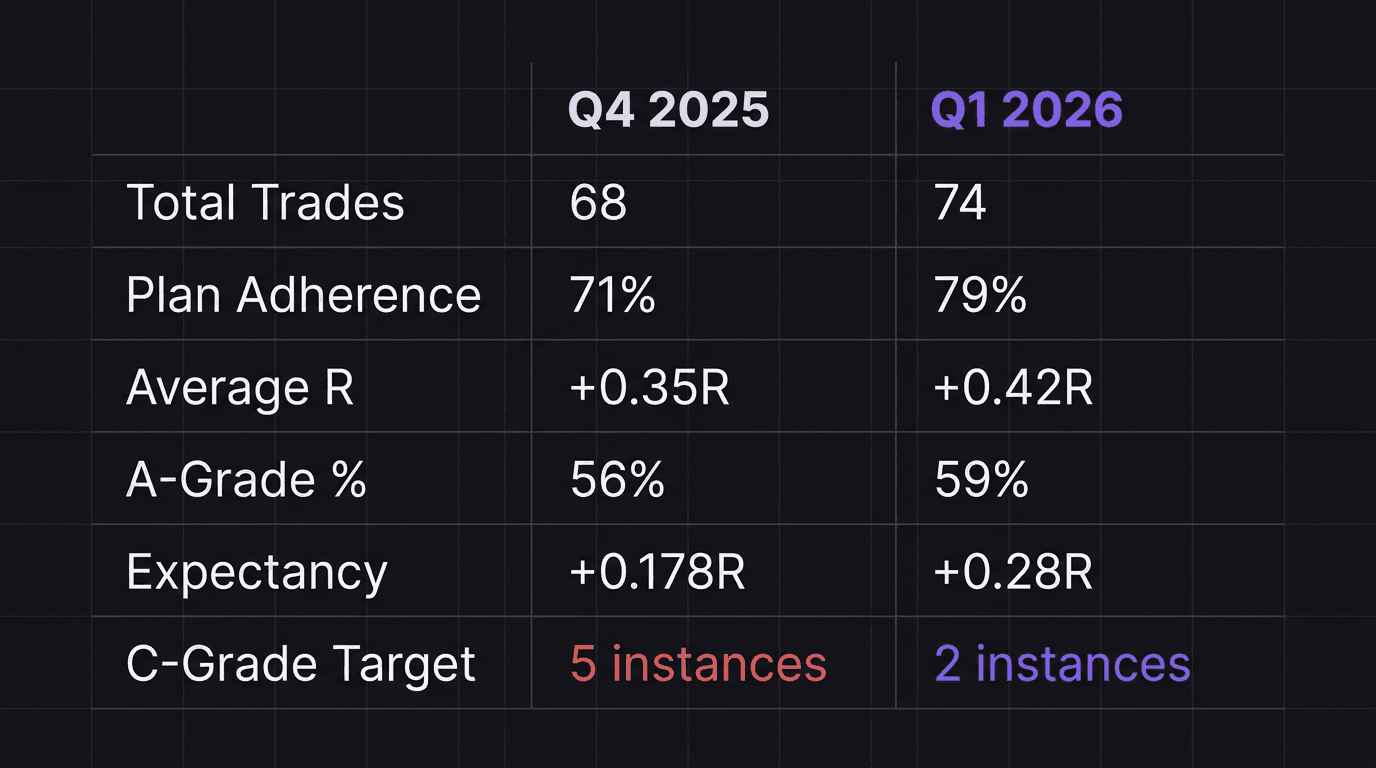
Q4 2025: 68 trades. Plan adherence: 71%. Average R: +0.35R per trade. Grade distribution: 38A/22B/8C (56%/32%/12%). Trading expectancy: (0.38 x 2.1R) minus (0.62 x 1.0R) = 0.798R minus 0.62R = +0.178R per trade.
Math check: - 38 wins out of 68 trades is approximately a 56% grade-A rate (not the same as win rate). - Win rate from journal: 38%. Average win: 2.1R. Average loss: 1.0R. - Expectancy: (0.38 x 2.1) minus (0.62 x 1.0) = 0.798 minus 0.62 = +0.178R.
Q1 2026: 74 trades. Plan adherence: 79%. Average R: +0.42R per trade. Grade distribution: 44A/20B/10C (59%/27%/14%). Expectancy: (0.40 x 2.2R) minus (0.60 x 1.0R) = 0.88R minus 0.60R = +0.28R per trade.
Math check: - Win rate from journal: 40%. Average win: 2.2R. Average loss: 1.0R. - Expectancy: (0.40 x 2.2) minus (0.60 x 1.0) = 0.88 minus 0.60 = +0.28R.
Progress assessment: Plan adherence up 8 percentage points. Average R improved. A-grade percentage up 3 points. C-grade behavior "entering before candle close" dropped from 5 to 2 instances. Expectancy improved from +0.178R to +0.28R per trade.
This trader is objectively improving. Even if Q1 ended with a net loss due to variance, the process metrics confirm skill growth.
What Progress Actually Looks Like
Real trading progress does not look like a hockey-stick P&L chart. It looks like small, boring improvements in the numbers that nobody else sees.
It looks like your plan adherence going from 68% to 74% to 79% over three quarters. It looks like your average R climbing from +0.2R to +0.35R to +0.42R as you eliminate C-grade trades. It looks like your journal logging rate staying above 95% for six months straight.
The P&L follows these improvements. But it follows on a delay, and it follows with noise. You might improve your process metrics for two quarters before the P&L catches up. That gap is where most traders quit. They see the numbers improving but the account staying flat, and they assume progress is not real.
It is real. The math is on your side. A strategy with positive expectancy, executed with high adherence over a large enough sample, produces positive returns. The only variable is time.
The traders who make it are the ones who measure the right things and stay patient long enough for the results to compound. Everyone else keeps chasing monthly P&L, switching strategies every six weeks, and wondering why they never improve.
Focus on process over outcome. Measure quarterly. Trust the numbers you can control. The money follows.
How EdgeFlo Tracks Your Progress
EdgeFlo's trading dashboard shows your process metrics in one place: plan adherence rate, average R, grade distribution, and equity curve all on the same screen. You do not need to build spreadsheets or calculate formulas manually.
The quarterly view lets you compare Q4 to Q1 side by side, so your quarterly review starts with the data already organized. The weekly AI report (Plus plan) flags when your adherence or grade distribution drifts from your targets, giving you early warning before the quarterly checkpoint.
Because EdgeFlo auto-imports trades, your logging rate stays high without extra effort. The data is there whether you remember to write it down or not. That consistency is what makes quarterly comparisons reliable instead of guesswork.
How do I measure trading progress if not by P&L?
Why is monthly P&L a bad progress metric?
What is a quarterly measurement window in trading?
What process metrics should I track as a beginner?

Turn discipline on.
Every session.
EdgeFlo is the environment serious traders operate inside.
Start 7-Day Trial — $7
Cancel anytime.
No long-term commitment.


Think Different, Trade Different.