

Quarterly Trading Review: The Only Time to Change Your Rules
Stop tweaking your plan after every loss. A quarterly trading review is the only scheduled time to refine rules, backed by enough data to make real decisions.

A quarterly trading review is a scheduled, data-backed session where you evaluate your trading rules and decide whether anything needs to change. It is the only time rule changes belong on the table. Everything else is noise.
Most traders change their plan too often. They lose three trades on Tuesday, scrap their entry criteria by Wednesday, and spend Friday hunting for a new strategy. By the end of the month, they have no idea what they are even testing anymore. Sound familiar?
The fix is not more willpower. The fix is a hard boundary: you review your rules once every 13 weeks, not after every red day. That boundary turns emotional reactions into structured decisions backed by real sample sizes.
TL;DR
Change your trading rules once per quarter, never after individual losses.
A quarterly review needs at least 50 to 100 trades to produce meaningful data.
Track win rate, average R, profit factor, and rule adherence across the full quarter.
Compare quarter-over-quarter trends, not week-to-week swings.
The review has three possible outcomes: keep rules, adjust one variable, or flag a setup for removal.
Why Casinos Never Change the Rules After a Bad Night
A casino runs roulette with a 5.26% edge on every spin. Some nights, the players win big. The house might lose tens of thousands in a single evening. But the casino does not panic. It does not switch the game, raise the stakes, or redesign the table.
Why? Because the casino knows its edge plays out over thousands of spins, not dozens. One bad night is irrelevant when you have a statistical advantage and enough volume.
Your trading plan works the same way. If you have backtested and forward tested your strategy, you already know it has positive expectancy over a meaningful sample. A single loss, or even five in a row, does not invalidate that. It is just the cost of playing a probabilistic game.
The moment you start tweaking rules after every loss, you are no longer the casino. You are the gambler who changes his bet after every spin, convinced that this time he has cracked the pattern. That is a fast track to strategy hopping, and strategy hopping destroys edge faster than any losing streak ever could.
What a Quarterly Review Actually Looks Like
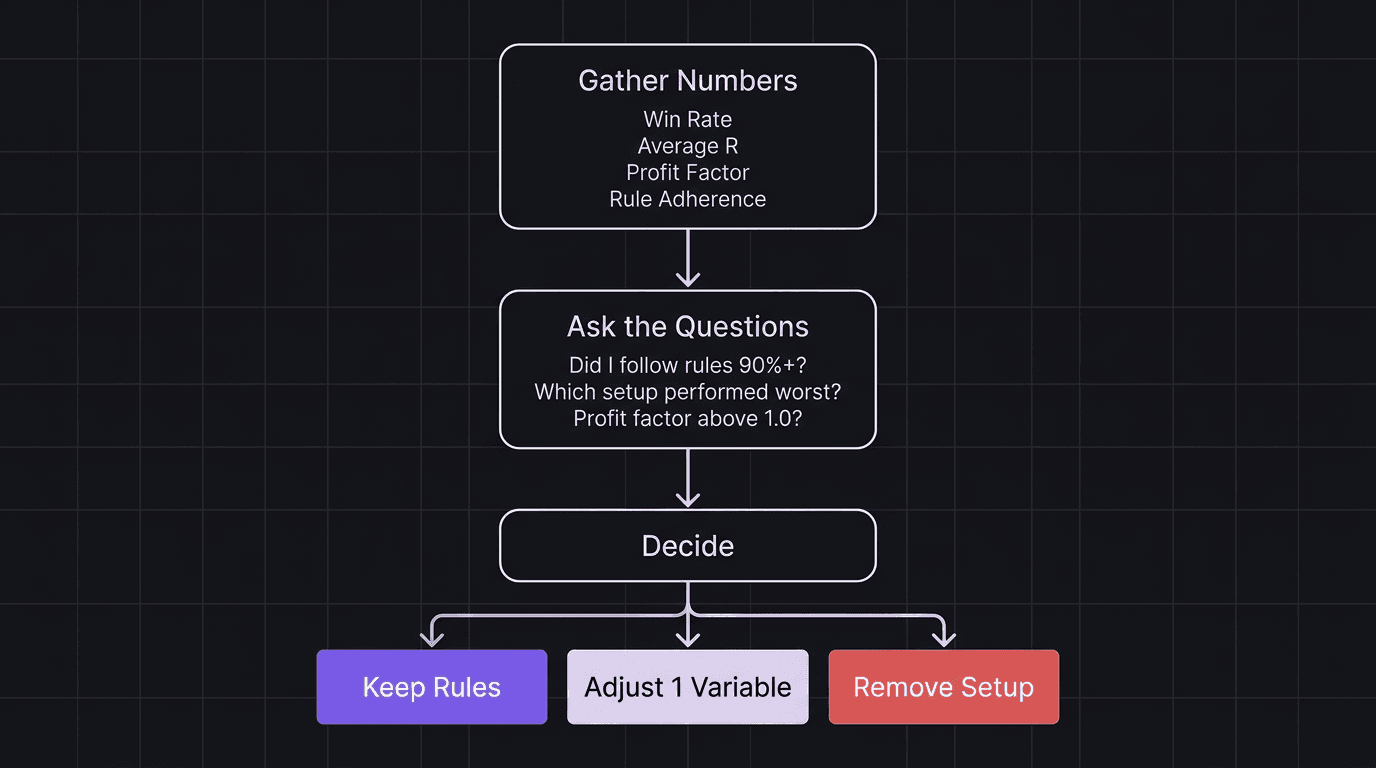
A quarterly review is not a vague "how did I feel about my trading?" session. It is a structured audit with specific inputs, specific questions, and a limited set of possible outputs.
Here is the process, broken into three phases.
Phase 1: Gather the Numbers
Pull your data for the full 13 weeks. You need these metrics at minimum:
Win rate across all setups
Average R (average winner size divided by average loser size)
Profit factor (gross profit divided by gross loss)
Total trades taken
Rule adherence rate (how many trades followed your plan exactly)
Setup breakdown (win rate and average R per individual setup type)
If you do not have these numbers, your trading journal template needs work before anything else.
Phase 2: Ask the Right Questions
With the numbers in front of you, work through these questions:
Did I follow my rules on at least 90% of trades?
Which setup type had the highest win rate? Which had the lowest?
Is my profit factor above 1.0 when I only count rule-following trades?
Did any setup produce zero or negative expectancy over the full quarter?
Were there specific sessions, pairs, or conditions where my edge disappeared?
Notice the pattern. Every question is about data across the entire quarter, not about individual trades.
Phase 3: Decide What Changes (If Anything)
This is where discipline matters most. Your quarterly review has exactly three possible outcomes:
Keep everything. The numbers support your current rules. Change nothing.
Adjust one variable. One setup or parameter underperformed with statistical significance. You modify that single element.
Flag a setup for removal. A setup produced negative expectancy over two consecutive quarters. You remove it from your playbook.
That is it. You do not redesign your entire strategy. You do not add three new indicators because you saw a YouTube video last week. You make one small, evidence-based change at most.
The Danger of Mid-Quarter Rule Changes
Here is what happens when you change rules before the quarter ends.
You take a loss on EUR/USD during London session. Your plan says to enter on a pullback to the demand zone after a break of structure. The setup met every criterion. Price just went the other way. That happens.
But instead of logging the loss and moving on, you decide that maybe your entry was too aggressive. You add a requirement for a second confirmation candle. Two days later, a perfect setup forms, but now your new rule makes you wait for that extra candle. Price leaves without you.
So you remove the confirmation candle rule and go back to your original plan. Then you take another loss. Now you add a different filter.
Walkthrough: The Mid-Quarter Spiral
A trader runs a pullback strategy on GBP/USD during London open. Over 3 weeks, she takes 12 trades: 5 winners at an average of 2.1R each, 7 losers at 1R each. Net result: +3.5R over 12 trades. That is a profitable stretch.
But it does not feel profitable because 4 of those 7 losses came in a row during week two. In frustration, she adds a moving average filter to her entries. Over the next 3 weeks, the filter screens out 5 setups. Two of those filtered setups would have been 3R winners. Her results drop to +1.3R over 8 trades.
Math check: 5 wins at 2.1R = 10.5R. 7 losses at 1R = 7R. 10.5R minus 7R = 3.5R. After the filter: 3 wins at 2.1R = 6.3R. 5 losses at 1R = 5R. Missed 2 wins at 3R = 6R of forgone profit. Actual net with filter: 6.3R minus 5R = 1.3R but only taking 8 trades instead of 12.
She did not have a strategy problem. She had a patience problem. The original system was working.
This is why mid-quarter changes are dangerous. You are making decisions based on a sample that is too small. Twelve trades tell you almost nothing about your edge. Eighty trades start to tell you something. A hundred or more is where patterns become reliable.
What Counts as "Enough Data" for a Quarterly Review
The law of large numbers is not just a statistics textbook concept. It is the reason casinos stay profitable and the reason your quarterly review needs a minimum sample size.
At 20 trades, your results are dominated by luck. A coin flipper could look like a genius or a failure over 20 flips. At 50 trades, patterns start to emerge but remain fragile. At 100 trades, you can start making cautious conclusions about your edge.
If you average 5 trades per week, 13 weeks gives you roughly 65 trades. That is a workable sample for broad conclusions, though not enough to evaluate each individual setup in isolation. If you take fewer trades, you may need to extend your review window to every 6 months.
The point is simple: never change a rule based on 10 or 15 trades. The data is not meaningful yet. You would not judge a roulette wheel's fairness after 15 spins, and you should not judge your strategy's edge after 15 trades.
Quarterly Review vs Weekly Review: Different Jobs
A weekly or monthly performance review is not the same thing as a quarterly rule review. Both matter, but they answer different questions.
Review Type | Frequency | Purpose | Can You Change Rules? |
|---|---|---|---|
Post-trade review | Every trade | Log what happened, tag emotions, note execution quality | No |
Weekly review | Weekly | Spot execution drift, check rule adherence, flag emotional patterns | No |
Monthly stats check | Monthly | Track cumulative metrics, compare to targets | No |
Quarterly rule review | Every 13 weeks | Evaluate strategy performance, decide on rule changes | Yes |
Your trading review process should include all four levels. But only the quarterly review has the authority to change your actual trading rules.
Think of it this way: the post-trade and weekly reviews are diagnostic. They tell you whether you are following the plan. The quarterly review is prescriptive. It tells you whether the plan itself needs adjusting.
Walkthrough: A Clean Quarterly Review in Action
A trader finishes Q1 with 87 trades on EUR/USD and GBP/USD using two setups: a pullback entry and a liquidity sweep entry. He pulls his numbers.
Pullback setup: 52 trades, 38% win rate, average winner 2.5R, average loser 1R. Expectancy per trade: (0.38 times 2.5R) minus (0.62 times 1R) = 0.95R minus 0.62R = 0.33R.
Liquidity sweep setup: 35 trades, 29% win rate, average winner 3.1R, average loser 1R. Expectancy per trade: (0.29 times 3.1R) minus (0.71 times 1R) = 0.899R minus 0.71R = 0.189R.
Math check: Pullback: 0.38 times 2.5 = 0.95. 0.62 times 1 = 0.62. 0.95 minus 0.62 = 0.33R per trade. Liquidity sweep: 0.29 times 3.1 = 0.899. 0.71 times 1 = 0.71. 0.899 minus 0.71 = 0.189R per trade.
Both setups have positive expectancy. Decision: keep both. No rule changes this quarter. The pullback setup outperformed, but the liquidity sweep setup is still profitable. Removing it would reduce total trade volume and slow down edge compounding.
He logs this decision, notes the numbers, and commits to running the same plan for Q2. That is a completed quarterly review.
The One-Change Rule
Even when your data clearly supports a modification, limit yourself to one change per quarter. Here is why.
If you change three things at once (entry criteria, stop placement, and target strategy), you have no way to measure which change helped or hurt. You have introduced three new variables into a system that was already producing data, and now the next quarter's data is contaminated by all three.
One change per quarter keeps your testing clean. You modify the weakest element, run it for another 13 weeks, and then measure the impact. That is how systematic improvement works. Slow, controlled, measurable.
This is the opposite of what most traders do. Most traders make five changes after a bad week, feel better for about three days, then make five more changes when the new setup does not immediately print green. The result is a plan that has been rewritten so many times it no longer resembles a plan at all.
How EdgeFlo Supports Your Quarterly Review
EdgeFlo's trading journal auto-imports your trades and tags each one with the data you need for a quarterly review. Win rate, average R, profit factor, and setup breakdowns accumulate automatically across the quarter. You do not need to build spreadsheets or manually calculate expectancy.
The dashboard surfaces these metrics over customizable time windows, so pulling a 13-week snapshot takes seconds instead of hours. When you sit down for your quarterly review, the numbers are already waiting.
Your Edge plan stores your active rules in one place. After you complete a quarterly review and decide on a change (or decide to keep everything), you update the plan once. That single source of truth stays visible during every session, so the rules you reviewed are the same rules you trade against the next day.
How often should I review my trading plan?
What should I include in a quarterly trading review?
Can I change my trading rules after a losing streak?
How many trades do I need before a quarterly review is useful?

Turn discipline on.
Every session.
EdgeFlo is the environment serious traders operate inside.
Start 7-Day Trial — $7
Cancel anytime.
No long-term commitment.


Think Different, Trade Different.