

Liquidity Sweep Entries: How Smart Money Loads Before the Move
Learn how liquidity sweep entries work. See how smart money grabs orders below equal lows before reversing, and how to combine sweeps with flip zones.

You see two clean lows sitting at the same price. Textbook support, right? So you buy at that level and place your stop right below. Price taps your level, drops through it by 10 pips, stops you out, and then rockets upward without you. Sound familiar?
That was a liquidity sweep. And the traders who bought after the sweep, not before, caught the entire move. Understanding why this happens and how to use it changes everything about your entry timing.
A liquidity sweep is not random. It is the mechanism institutions use to fill large positions. They need your stop-loss orders to execute their entries. Once they have enough liquidity, price reverses. If you know where the liquidity sits and wait for the sweep to complete, you enter where smart money enters.
TL;DR
A liquidity sweep occurs when price drives through a level where stop-loss orders are stacked, fills those orders, and then reverses.
Equal lows are the most common liquidity targets because retail traders cluster stops just below them.
The sweep plus flip zone model combines a liquidity grab with a zone flip for the highest-conviction entries.
Wait for the sweep to finish and a market structure shift to confirm before entering.
Never enter at obvious support levels without considering that smart money might sweep them first.
What Is a Liquidity Sweep
Every stop-loss order sitting in the market is unfilled liquidity. When you place a sell stop below your long position, you are adding a sell order to the order book at that price. Multiply that by thousands of traders placing stops at the same obvious level, and you have a pool of sell orders waiting to be triggered.
Institutions need those sell orders to buy. When a large fund wants to enter a long position worth millions, they cannot just click "buy" at market price. The order is too large. It would push price up before they fill the entire position. Instead, they push price down into the pool of sell stops. Every triggered stop-loss becomes a sell order that the institution buys against. They get filled at a better price, and the pool of retail sellers provides the liquidity they need.
That push below the key level is the sweep. Price drops through the level, triggers the stops, and then reverses once the institution has filled their position.
Price creates a visible low (or multiple lows near the same price).
Retail traders place stop-loss orders just below.
Price drops through the low, triggering all those stops.
Institutional buyers fill against the triggered sell orders.
Price reverses sharply upward.
The entire process can take minutes on lower timeframes or days on higher timeframes. The mechanics are the same regardless of scale.
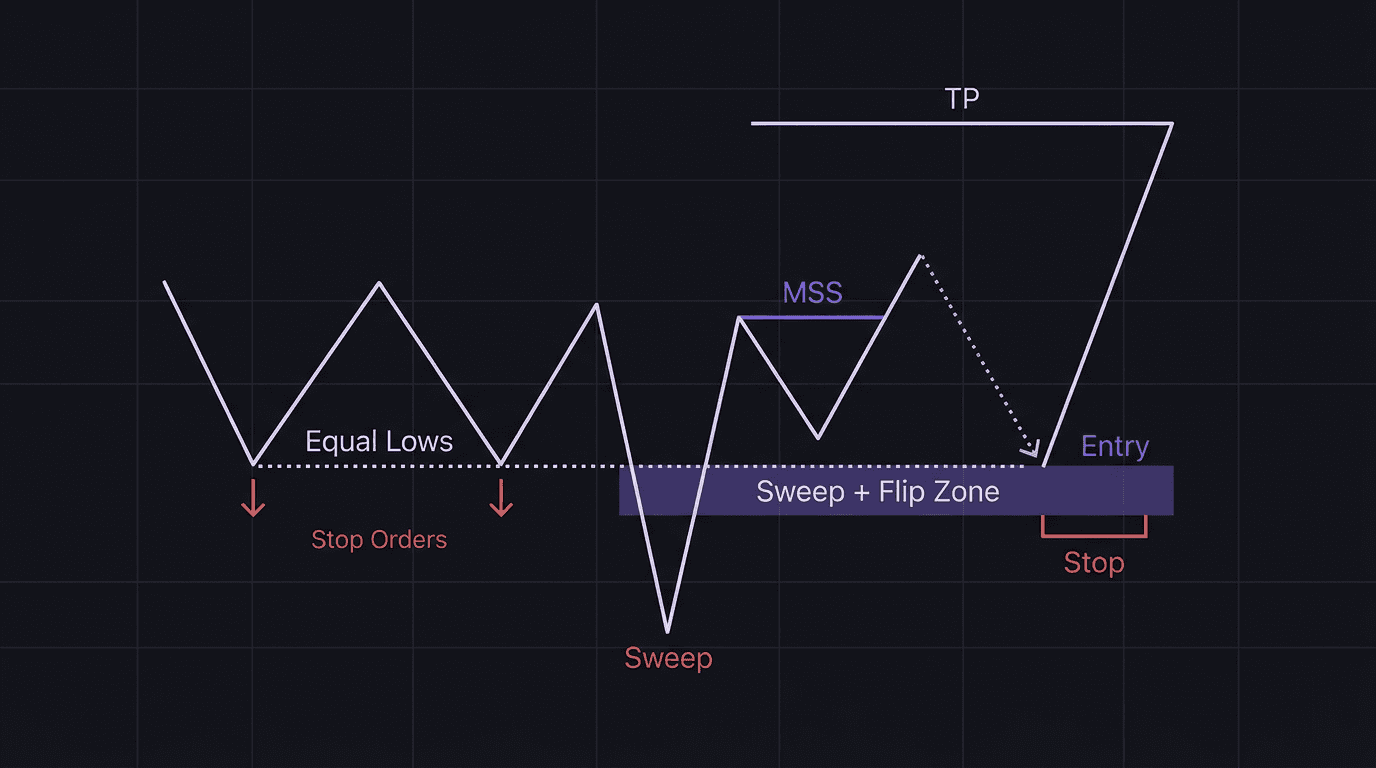
The Sweep Plus Flip Zone Model
A plain liquidity sweep gives you a reason to look for entries. A sweep combined with a flip zone gives you a precise entry point.
Here is how the model works:
Price is in a downtrend, creating lower highs and lower lows.
Price reaches a demand zone and reacts, pushing up toward the last supply zone.
Instead of making a clean higher low, price first drops below the previous lows (the sweep), taking out all the stop-loss orders.
After the sweep, price reverses and starts creating a flip zone. The supply zone that was pushing price down fails. A higher low forms.
The area where the sweep occurred and the flip happened is your sweep plus flip zone.
Wait for the market structure shift (break above the last lower high).
Enter when price pulls back to retest the sweep plus flip zone.
This model is stronger than a regular flip zone because the sweep has already cleaned out the weak longs. The traders who had stops below the lows are gone. There is no more selling pressure from triggered stops. The remaining orders are institutional buys.
Walkthrough: EUR/USD Sweep Plus Flip Entry
EUR/USD on the 4-hour chart shows a downtrend with lower highs at 1.0880 and 1.0850. Price creates two lows at 1.0790 and 1.0792, forming near-equal lows. Retail traders see "double bottom support" and buy, placing stops below 1.0785.
Price drops to 1.0775, sweeping below both lows. Every stop-loss order below 1.0785 triggers. But instead of continuing lower, price reverses immediately. On the 15-minute chart, price rallies from 1.0775, creates a market structure flip at 1.0785 (the old support turned demand after the sweep), and breaks above the last 15-minute lower high at 1.0810.
The sweep plus flip zone sits at 1.0775 to 1.0790. You enter long on the retest at 1.0788 with a stop at 1.0770 (below the sweep low) and a target at 1.0870 (the next unmitigated supply zone).
With an 18-pip stop and an 82-pip target, that is a 4.56:1 risk-to-reward ratio. On 0.5 lots ($5 per pip), you risk $90 and the potential reward is $410. The tight stop is possible because the sweep already cleared out the orders below the lows. Your stop sits below the deepest point of the sweep, where price already proved buyers are in control.
Why Equal Lows Are Liquidity Magnets
Not all swing lows attract sweeps equally. Equal lows are the most targeted because they create the densest cluster of stop-loss orders.
When price forms two or more lows at nearly the same price, every technical analysis textbook calls it support. Traders buy at that level. And where do they all place their stops? Just below those equal lows. The tighter the cluster of lows, the more concentrated the stop orders.
Institutions know this. They can see order flow data that shows where stops are stacking. Equal lows on the 15-minute chart, the 1-hour chart, or the 4-hour chart become targets. The more visible the level, the more liquidity sits below it.
This is why "support" breaks so often. It is not breaking because the level failed. It is breaking because the level worked too well. Too many traders respected it, which created too much liquidity. Smart money swept the stops and then drove price in the direction the level was supposed to protect.
Think about it differently. If you see equal lows on a chart, do not ask "will this support hold?" Ask "how much liquidity sits below this, and does someone want to grab it?" If the answer is yes (and it usually is at obvious levels), wait for the sweep before entering.
Reading the Sweep in Real Time
Recognizing a sweep as it happens requires watching price behavior at the key level, not just the level itself.
Before the sweep: Price approaches equal lows or a visible support level. It may consolidate just above the level for several candles, building anticipation. Retail traders start entering long positions, adding more stops below the level.
During the sweep: Price pierces through the level with a quick, sharp move. On the lower timeframe, you see a sudden push down followed by immediate buying. The candle wick extends well below the level, but the body often closes back above or near it. This is the classic sweep pattern: wick below, body above.
After the sweep: Price moves aggressively in the opposite direction. On the lower timeframe, you start seeing higher lows form. The order flow shifts. A break of structure to the upside confirms the reversal.
What if the sweep continues? Not every dip below a level is a sweep. Sometimes price breaks the level and keeps going. The difference is what happens immediately after the break. A genuine sweep shows immediate rejection, with price snapping back above the level within a few candles. If price closes below the level and stays there, it is not a sweep. It is a genuine breakout lower. In that case, your plan says no entry.
Walkthrough: Missed Sweep, Wrong Entry
A trader sees GBP/USD form three lows at 1.2500, 1.2503, and 1.2498 on the 1-hour chart. Textbook triple bottom. They enter long at 1.2505 with a stop at 1.2485.
Price drops to 1.2480, sweeping all three lows and triggering the trader's stop. The loss is 25 pips. On 0.5 lots ($5 per pip), that is $125 gone.
The loss is 20 pips ($100 on 0.5 lots). Price then reverses from 1.2480, rallies back above 1.2510, and continues to 1.2600. The trader was right about direction but entered before the sweep. If they had waited for the sweep and entered on the retest of the sweep-plus-flip zone at 1.2490, their stop would have been at 1.2475 (15 pips) and their target at 1.2600 (110 pips), giving a 7.3:1 risk-to-reward ratio.
The lesson: entering at obvious support levels means you are the liquidity. Entering after the sweep means you are using someone else's liquidity. Backtest your strategy with and without the sweep filter to see how much it improves your hit rate.
How EdgeFlo Tags Sweep-Based Entries
A sweep plus flip entry is a specific setup. Over time, you need to know how often it produces winners compared to your other setups. Are sweep entries your best performer or your worst? You will not know unless you track them separately.
EdgeFlo's trading journal supports custom setup tags. After each trade, you tag it with the setup type: "sweep plus flip," "BOS continuation," "zone retest," or whatever labels match your playbook. Over a sample of 30 or more sweep entries, you see the real numbers: win rate, average R, and total expectancy.
If your sweep plus flip entries hit 60% with an average 3.5R and your plain zone retests hit 40% with 2R, the data tells you where to focus your screen time. That kind of specific feedback only comes from disciplined tagging.
What is a liquidity sweep in trading?
What is a sweep plus flip zone?
Why are equal lows liquidity magnets?
How do you enter a trade after a liquidity sweep?

Turn discipline on.
Every session.
EdgeFlo is the environment serious traders operate inside.
Start 7-Day Trial — $7
Cancel anytime.
No long-term commitment.


Think Different, Trade Different.