

How to Read a Liquidity Sweep: 2 Signals That Confirm the Move
A liquidity sweep means nothing without confirmation. Learn the two signals (V-shaped reaction and internal structure break) that confirm the move is real.

Price takes out a key low, your stop gets hit, and then the market reverses exactly where you were positioned. Sound familiar?
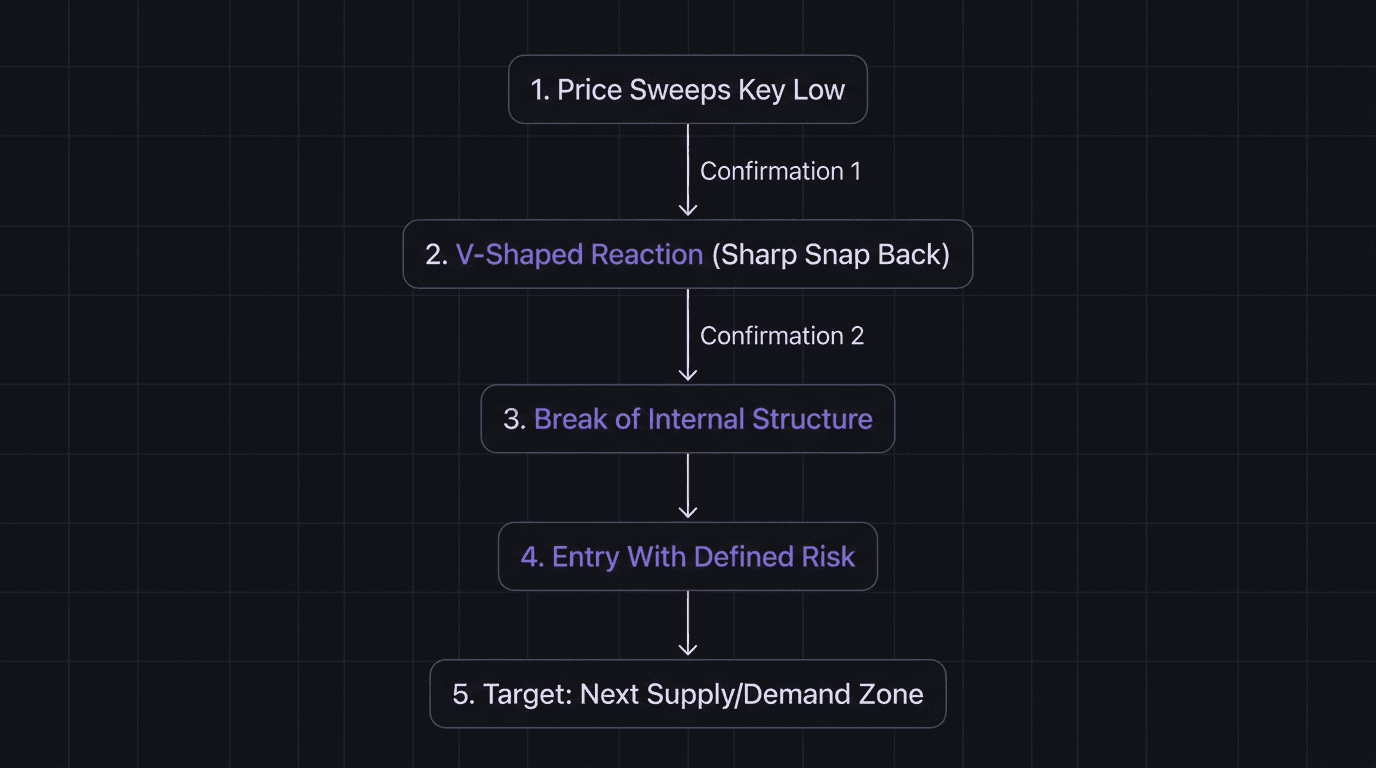
That reversal after the stop hunt is a liquidity sweep. But the sweep itself is not a trade signal. It is what happens after the sweep that matters. Two specific reactions confirm whether the move is real or just noise, and trading without both confirmations is how accounts bleed out one fakeout at a time.
TL;DR
A liquidity sweep grabs resting orders (stop losses and pending orders) below or above key levels before the real move begins.
The first confirmation is a V-shaped reaction: price snaps back aggressively from the swept level.
The second confirmation is a break of internal structure: price takes out the last swing point in the new direction.
Trading on one signal alone (just the sweep, or just the V-shape) leads to premature entries and unnecessary losses.
Wait for both confirmations during an active session (London or New York) before committing capital.
What Happens After a Liquidity Sweep
When price sweeps below a swing low, it triggers stop-loss orders from traders who were long and sell-stop orders from traders trying to catch the breakout. That cluster of triggered orders gives institutions the liquidity they need to fill large buy positions.
But here is the catch. The sweep completing does not guarantee that institutions actually stepped in. Sometimes price sweeps a level and keeps going. Other times it sweeps, pauses, and chops sideways for hours.
The difference between a real institutional sweep and a meaningless poke below a low comes down to what price does in the next few candles. You need two specific reactions before you can confidently say the sweep was valid.
Signal 1: The V-Shaped Reaction
The first thing you want to see after a sweep is a sharp, aggressive snap back in the opposite direction. This V-shaped reaction tells you that the orders sitting at that level have been absorbed and that buying (or selling) pressure immediately overwhelmed the move.
What does a V-shape actually look like? On a 5-minute or 15-minute chart, you will see price wick below the key low and then produce a large-bodied candle in the opposite direction within one or two bars. The body of that reaction candle should close well above the swept level.
Walkthrough: EUR/USD V-Shape at London Open
EUR/USD is in a higher-timeframe uptrend. During the Asian session, price creates a swing low at 1.0845 with equal lows forming near 1.0843. At 3:15 AM EST (London Open), price drops to 1.0838, sweeping below the equal lows by 5 pips. Within the same 5-minute candle, price reverses sharply and closes at 1.0856, forming a large bullish engulfing candle with a long lower wick. That 18-pip snap from low to close is the V-shaped reaction. It confirms that the orders below 1.0843 were absorbed and buyers stepped in aggressively.
A weak reaction looks different. If price sweeps below the low and then crawls back up over six or seven candles with small bodies and overlapping wicks, that is not a V-shape. That is consolidation, and it does not confirm anything.
Signal 2: Break of Internal Structure
The V-shape tells you the sweep was absorbed. But it does not tell you where price is going next. For that, you need a break of internal structure.
Internal structure is the series of short-term highs and lows that form within a pullback. During a bullish pullback (price pulling back within an uptrend), internal structure creates lower highs and lower lows. The pullback is "over" when price breaks above the most recent internal higher high or swing high within that pullback.
So after the V-shaped reaction, you watch for price to take out the last internal swing high. That break confirms the pullback is complete and trend continuation is underway.
Walkthrough: The Confirmation That Separates Winners from Trap Victims
Continuing the EUR/USD example. After the V-shape at 1.0838, price rallies to 1.0856, then pulls back to 1.0849. The last internal swing high before the sweep was at 1.0858. Price pushes through 1.0858 at 3:40 AM EST, closing a 5-minute candle at 1.0862. That is the break of internal structure. Your entry is at 1.0862, stop loss below the sweep low at 1.0835 (27 pips of risk), and target at the next supply zone near 1.0935 (73 pips of potential gain).
Without the internal structure break, you would have entered after the V-shape at 1.0856 and watched price pull back to 1.0849, potentially shaking you out before the real move started.
Why One Signal Is Not Enough
Trading on the V-shape alone is one of the most common mistakes intermediate traders make. The V-shape tells you the sweep was absorbed, but it does not tell you the pullback is finished. Price can V-shape, rally slightly, and then roll over to create a deeper pullback or even a full reversal.
Trading on the sweep alone (without any confirmation) is even worse. You are entering blindly at a level simply because price touched it. That is the equivalent of catching a falling knife and calling it a strategy.
Here is what happens when you skip each signal:
Skipping Signal 2 (structure break): You enter after the V-shape at 1.0856. Price pulls back to 1.0840. Your stop at 1.0835 survives, but the drawdown shakes your confidence. You close early at 1.0855 for a scratch. Then price rallies to 1.0935 without you.
Skipping Signal 1 (V-shape): Price breaks internal structure at 1.0858, but there was no V-shape. The "sweep" was actually just a slow grind lower that never attracted institutional buying. Price breaks 1.0858 on low volume, stalls at 1.0865, and reverses back down to 1.0820.
Both signals filter for the same thing: institutional participation. The V-shape proves orders were filled. The structure break proves directional commitment. Together they create a confirmation model that keeps you out of traps.
Timing Matters: When to Watch for These Signals
Sweeps can happen at any time, but the ones worth trading happen during active sessions. The London Open (3:00 AM to 6:00 AM EST) and the London/New York Overlap (8:00 AM to 11:00 AM EST) produce the highest-quality sweeps because institutional participation is at its peak.
A sweep that happens at 11:00 PM EST during the Asian session might produce a V-shape, but it rarely produces follow-through. There simply is not enough volume to sustain the move. The structure break either never comes or leads to a 10-pip rally that fizzles.
Wait for the active session. Mark your liquidity levels during prep time. Then watch for the two-signal confirmation during the window where institutions are actually trading.
The Mistake of Acting Too Early
A trader spots equal lows at 1.0850 on GBP/USD during the Tokyo session at 10:30 PM EST. Price wicks below to 1.0844 and snaps back. They call it a V-shape and enter long at 1.0852. But there is no internal structure break. Price consolidates between 1.0845 and 1.0855 for four hours. When London opens, price sweeps 1.0844 again, this time dropping to 1.0830, and the trader gets stopped out. The real sweep and confirmation happen at 3:20 AM EST with a V-shape from 1.0828 and a structure break at 1.0860.
The lesson: the sweep during the dead session was not the real sweep. The market needed London liquidity to produce the genuine move.
How EdgeFlo Logs Sweep Confirmations
EdgeFlo's trading journal lets you tag entries by setup type, so you can label each trade as a confirmed sweep (both signals present), a partial confirmation (one signal only), or an unconfirmed entry. Over 30 to 50 trades, your journal reveals which confirmation level actually produces positive expectancy. Most traders discover that trades with both confirmations win at a significantly higher rate. That data builds conviction to wait for the full setup instead of jumping early.
What is a liquidity sweep in trading?
What confirms a liquidity sweep is valid?
Can you trade every liquidity sweep?
Where do liquidity sweeps happen most often?

Turn discipline on.
Every session.
EdgeFlo is the environment serious traders operate inside.
Start 7-Day Trial — $7
Cancel anytime.
No long-term commitment.


Think Different, Trade Different.