

Sample Size in Trading: Why 100 Trades Is the Minimum
One bad week does not mean your strategy is broken. Learn why 100 trades is the minimum sample size to judge any trading system and how to track your data.

You had three losing trades this week. The strategy you spent months building suddenly feels broken. Time to scrap it and start over, right?
Not even close. Three trades tells you almost nothing about whether your system works. The real problem is not your strategy. The real problem is that you are judging it on a sample size so small that randomness controls the result.
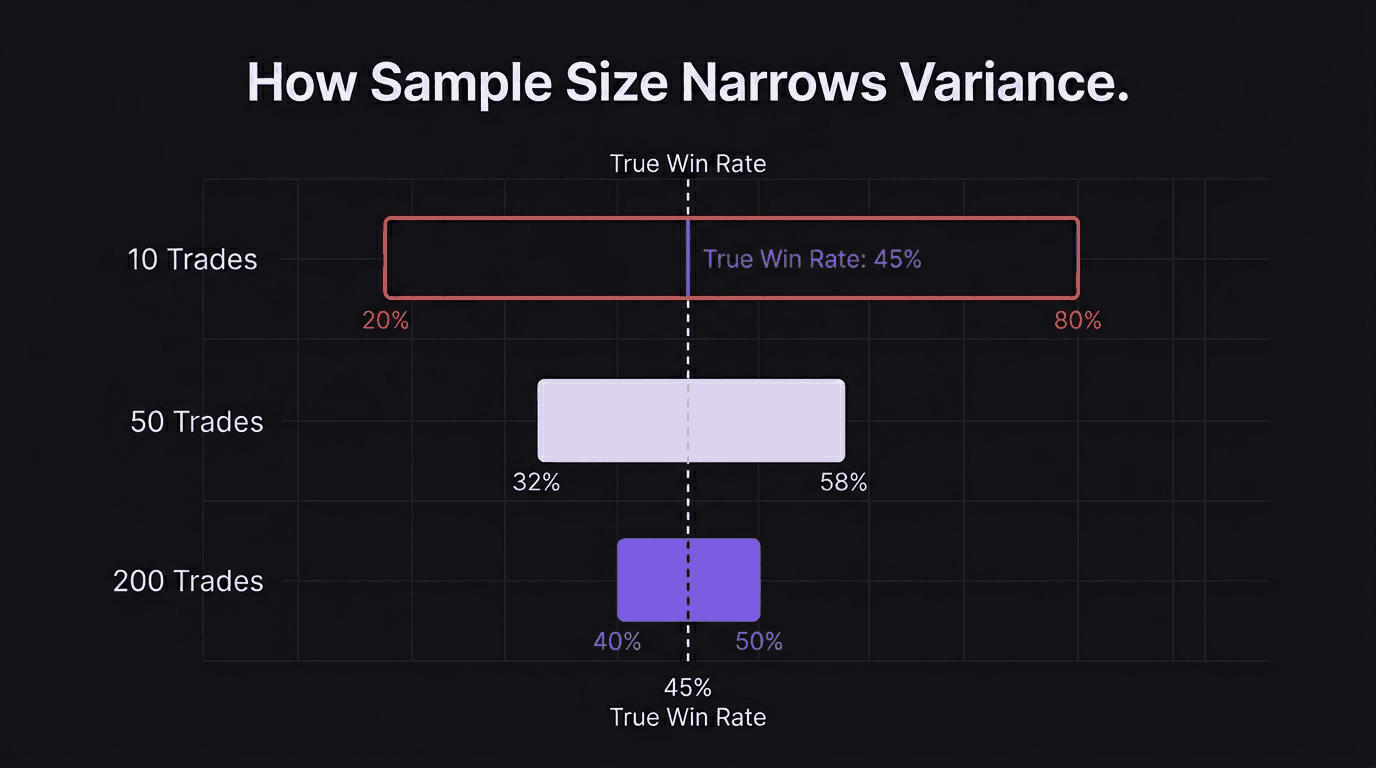
The minimum sample size to evaluate any trading strategy is 100 trades. Below that number, variance distorts your data so badly that winners look like losers and losers look like winners. Above it, the law of large numbers starts doing its job, and your actual edge (or lack of one) becomes visible.
TL;DR
You need at least 100 trades under identical rules before judging any strategy.
Short-term results (under 30 trades) are dominated by variance, not skill.
The law of large numbers is the reason casinos profit and why your edge needs volume to appear.
Track every trade in a journal or dashboard so you can reach 100 with clean data.
A strategy that "doesn't work" after 12 trades might be perfectly profitable at 200.
Why Small Samples Lie to You
Flip a coin 10 times. You might get 7 heads and 3 tails. Does that mean the coin is rigged? Of course not. The sample is too small for the true 50/50 probability to show up.
Trading works the same way. A strategy with a genuine 45% win rate and a 3:1 reward-to-risk ratio is solidly profitable over hundreds of trades. But over 10 trades, that same strategy could easily produce 2 wins and 8 losses. You would look at those results and conclude the strategy is garbage.
That conclusion would be wrong. And it would cost you money, because you would abandon a profitable system and start searching for another one. Sound familiar?
The gap between what short-term results show you and what your strategy actually produces is called variance. Every trader deals with it. The ones who survive are the ones who understand it.
The Law of Large Numbers (And Why Casinos Love It)
Casinos do not win every hand. They do not win every spin. On any given night, the house might lose money. But they never panic. They never change the rules of blackjack after a bad Tuesday.
Why? Because they understand the law of large numbers.
The law of large numbers states that as your sample size increases, your observed results converge toward the true expected value. In plain terms: the more repetitions you run, the closer your actual results get to what the math predicts.
A casino running roulette has roughly a 5.26% edge on every spin. On 10 spins, that edge is invisible. The player might be up big. On 1,000 spins, the casino's profit starts looking very close to 5.26% of the total amount wagered. On 100,000 spins, it is almost exactly 5.26%.
The casino does not need to win every spin. It needs volume. Your trading strategy works the same way.
What 100 Trades Actually Reveals
At 100 trades, three critical metrics start becoming reliable:
Win rate. With fewer than 30 trades, your observed win rate can swing wildly. At 100, it settles close enough to the true value that you can start making decisions from it.
Average R. Your average reward relative to risk per trade needs volume to stabilize. One outlier win on trade #7 can skew your average R for months if you only have 15 trades in the dataset.
Expectancy. This is the metric that actually predicts profitability: (win rate x average win) minus (loss rate x average loss). Expectancy calculated from 100 trades is something you can trust. Expectancy from 20 trades is a guess.
Walkthrough: The 12-Trade Illusion
Imagine you are trading GBP/USD with a breakout strategy. Your rules say: enter on a break of structure above the London session high, risk 1% per trade, target 2.5R.
After 12 trades, your results look like this:
4 wins, 8 losses
Win rate: 33%
Average win: 2.4R
Average loss: 1.0R
Your gut says this strategy is broken. But run the expectancy math:
Expectancy = (0.33 x 2.4) - (0.67 x 1.0)
0.33 x 2.4 = 0.792
0.67 x 1.0 = 0.67
0.792 - 0.67 = 0.122R per trade
That is a positive expectancy of 0.122R per trade. The strategy is profitable. You just cannot see it clearly yet because 12 trades is not enough data.
At 100 trades, if the true win rate is closer to 40% (which 12 trades could easily be masking), your expectancy jumps:
0.40 x 2.4 = 0.96
0.60 x 1.0 = 0.60
0.96 - 0.60 = 0.36R per trade
Same strategy. Same rules. Completely different picture once the sample size catches up.
The Danger Zone: 10 to 30 Trades
This is where most traders make their worst decisions. They have just enough data to feel confident but nowhere near enough data to be right.
At 10 trades, a strategy with a true 45% win rate could show anywhere from 10% to 80% observed wins. That is not an exaggeration. The statistical range at that sample size is enormous.
At 30 trades, the range narrows but is still wide enough to mislead you. A 45% strategy might show 33% or 57%, and both results are statistically normal.
This is why traders who change their plan after every losing week never find consistency. They are reacting to noise, not signal. By the time a real pattern forms, they have already abandoned the strategy and moved on to the next one.
Walkthrough: What NOT to Do
A trader backtests a supply and demand strategy on EUR/USD. Over 40 backtest trades, it shows a 50% win rate with 2:1 reward to risk.
He goes live. After 8 live trades, he has 2 wins and 6 losses (25% win rate). He panics, decides the strategy "doesn't work live," and switches to a moving average crossover system he saw on YouTube.
The problem is obvious once you know about sample size. Eight trades is not enough to judge anything. His backtest showed the strategy works. The live sample was too small to override that evidence.
If he had continued to 100 live trades, the win rate would almost certainly have pulled back toward the 45 to 50% range he saw in testing. Instead, he is back to square one with a new strategy and zero data.
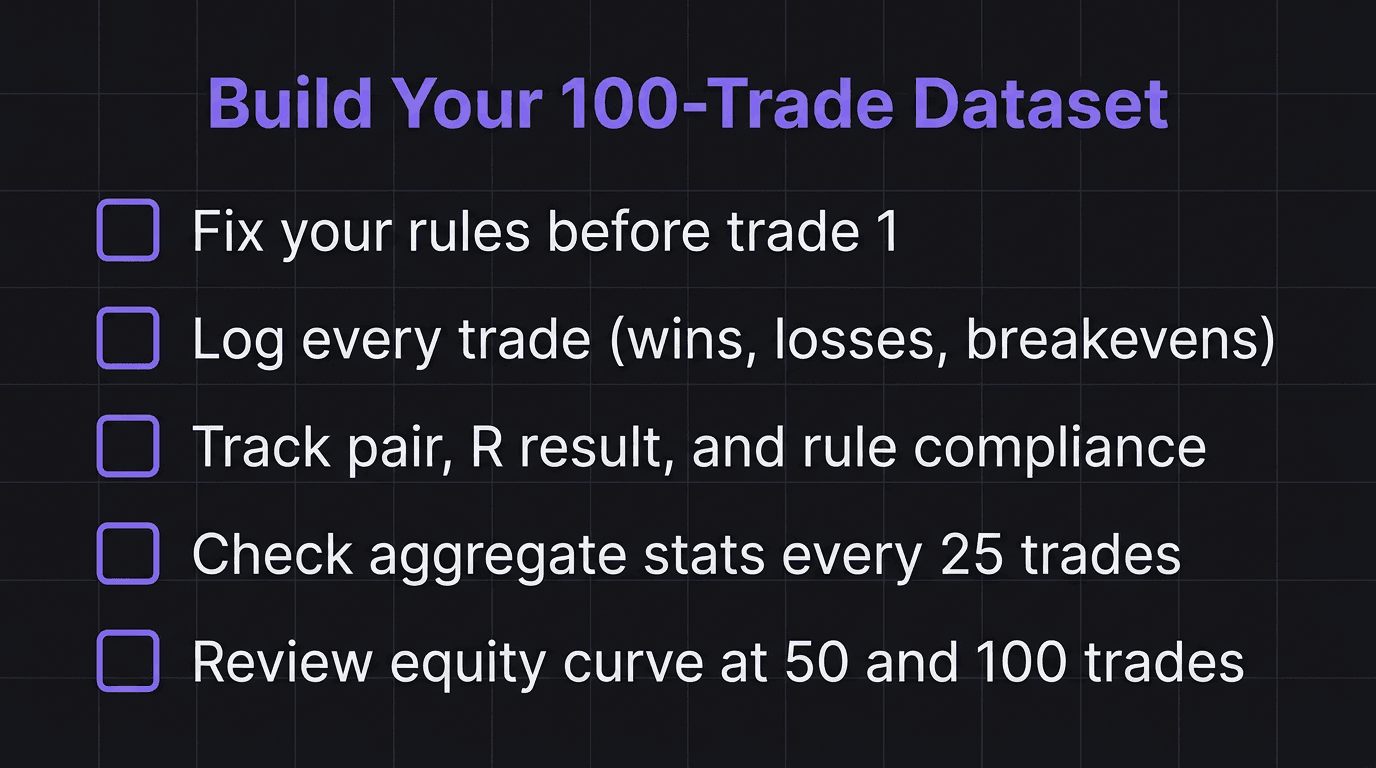
How to Build Your 100-Trade Dataset
Getting to 100 trades is not complicated, but it requires patience and discipline.
Step 1: Fix your rules. Write down your entry criteria, stop loss placement, target, and position sizing rules. Do not change them until you have 100 trades logged. If you adjust rules at trade 40, you need to start counting from zero again.
Step 2: Log every trade. Every single one. Wins, losses, breakevens, trades you exited early. Missed trades do not count toward your sample, but logging them in your journal separately helps you see hesitation patterns.
Step 3: Track the right metrics. For each trade, record: pair, direction, entry price, stop price, target price, result in R, and whether you followed your rules. The rule-following column matters because trades where you broke your plan should be flagged as contaminated data.
Step 4: Do not peek at P&L too often. Check your aggregate stats every 25 trades, not every day. Daily P&L checks during a small sample are emotional poison. They make variance feel personal.
Step 5: Use your equity curve as the big-picture view. Instead of obsessing over individual trades, look at the shape of your equity curve at regular intervals. A curve that trends upward over 100 trades (even with drawdowns) is evidence that your edge is real.
What Happens After 100?
One hundred is the minimum, not the finish line. At 100 trades, your data becomes usable. At 200, it becomes convincing. At 500, you have strong statistical significance.
But 100 is the threshold where you can start making real decisions:
If expectancy is positive after 100 trades, your edge is likely real. Keep trading the system.
If expectancy is negative after 100 trades, you have a meaningful signal that the strategy needs adjustment. This is the right time to refine (not after trade 8).
If expectancy is near zero after 100 trades, you need more data. The edge might be very small, and it needs a larger sample to confirm.
The quarterly review cycle makes this practical. Trade your system for a full quarter, log everything, and review the aggregate data at the end. That review is where you earn the right to change rules, not after a random losing Thursday.
How EdgeFlo Helps You Reach 100 Clean Trades
Reaching 100 trades means nothing if your data is messy. EdgeFlo's trading dashboard tracks your win rate, profit factor, and EdgeScore across every logged trade, so you can watch your metrics stabilize as your sample grows.
The Edge plan builder gives you a single place to document your rules before trade one. When the rules live next to your chart, you are less likely to improvise at trade 35 and contaminate your dataset.
Every trade auto-imports into your journal, which means no gaps in your data. Gaps in a 100-trade sample are almost as bad as a small sample, because missing trades introduce selection bias. EdgeFlo removes that risk by capturing everything.
How many trades do I need to judge a trading strategy?
Can I count backtest trades toward my sample size?
What if my strategy only takes 2 trades per week?
Does sample size matter more than win rate?

Turn discipline on.
Every session.
EdgeFlo is the environment serious traders operate inside.
Start 7-Day Trial — $7
Cancel anytime.
No long-term commitment.


Think Different, Trade Different.