

How to Avoid Fake Breakouts: Reading the Trap Before It Closes
Fake breakouts trap retail traders into losing entries. Learn to spot inducement traps, wait for confirmation, and avoid the psychology behind premature entries.

A fake breakout is a price move that breaks past a key level, triggers entries, and immediately reverses. It traps traders who reacted to the break instead of waiting for confirmation. Understanding why these traps form, and how to avoid them, separates consistent traders from those who keep giving money to the market.
The core problem is impatience. You see price break a level, your adrenaline spikes, and you enter. Then the reversal comes, and you are underwater before you have time to think. This pattern repeats because fake breakouts are not random. They are structural events driven by liquidity and order flow.
TL;DR
Fake breakouts happen when price sweeps resting orders at obvious levels before reversing.
Retail traders get trapped because they enter on the first break instead of waiting for confirmation.
The confirmation rule: wait for a candle body close, a retest, and a structural shift before entering.
Inducement traps (pull and push moves) are designed to trigger early entries before the real move.
Journaling your breakout trades reveals which setups are traps and which are real.
What Makes a Breakout Fake
A real breakout happens when price moves past a key level and continues. A fake breakout does the opposite. Price pushes past the level just far enough to trigger stop losses and pending orders, then snaps back.
Think about a resistance level where price has been rejected three times. Every trader watching that level places their buy stop above it. When price finally pushes through, those orders fill. But instead of continuing, price reverses immediately. The traders who just entered are now trapped with instant losses.
This is not coincidence. Market structure tells you that levels where orders cluster attract price. The sweep happens because the market needs those orders to fill large institutional positions on the other side.
Walkthrough: The GBP/USD London Open Trap
GBP/USD has been ranging between 1.2700 and 1.2750 during the Asian session. At London open, price spikes to 1.2758, triggering buy stops above 1.2750. Within 15 minutes, price reverses and drops to 1.2680. A trader who bought the breakout at 1.2752 with a 20-pip stop at 1.2732 gets stopped out for a full loss when price blows through.
The setup looked clean. Three touches on resistance. Momentum candle breaking through. But there was no confirmation. No candle body close above the level on a higher timeframe. No retest. Just a wick spike and a reversal.
The lesson: the first break is not your entry signal. The first break is often the trap.
Why Retail Traders Fall for the Trap
Retail traders get trapped for three reasons, and all three are psychological.
First, fear of missing out. You have been watching a level for hours. When it finally breaks, the urgency to get in overwhelms your process. You skip your checklist because the move looks strong.
Second, confirmation bias. You already decided the direction. The breakout confirms what you wanted to see, so you ignore the warning signs. The wick. The lack of volume. The fact that the break happened at a liquidity pocket.
Third, pattern recognition without context. You memorized "breakout equals entry" without understanding that breakouts need structural confirmation to be valid. Not every break of a level is a break of structure. Some breaks are sweeps designed to trap early entries.
Sound familiar? Most traders have been on the wrong side of this at least a dozen times before they recognize the pattern.
The Confirmation Rule That Saves Accounts
The confirmation rule is simple. Do not enter on the break. Enter after the break proves itself.
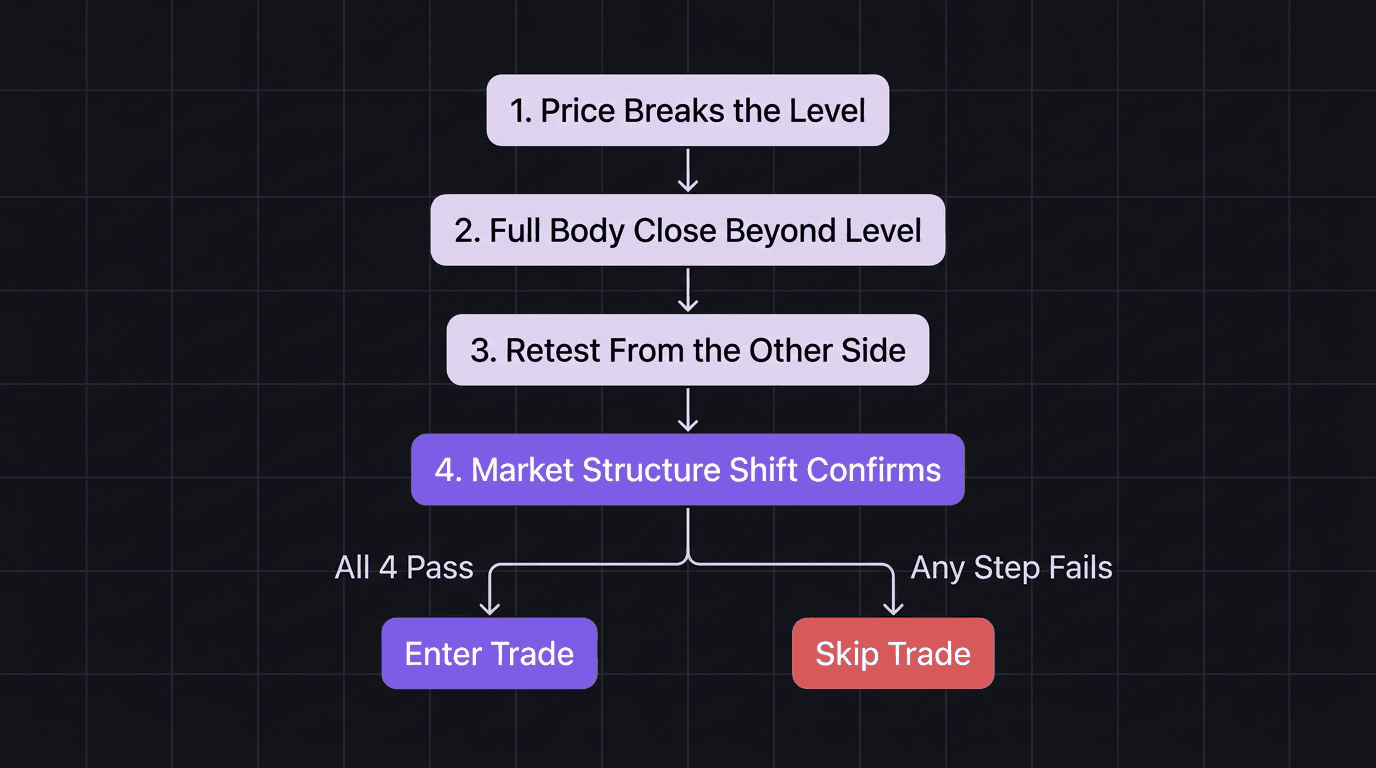
Here is the sequence:
Price breaks the level.
A full candle body closes beyond the level (not just a wick).
Price retests the broken level from the other side.
A market structure shift confirms the new direction.
If any of these steps fail, you skip the trade. That is the entire rule.
The hardest part is step four. A market structure shift means the lower timeframe prints a higher low (for a bullish break) or a lower high (for a bearish break). Without that shift, you are entering into potential noise.
Walkthrough: EUR/USD Confirmed Break vs Fake
EUR/USD has resistance at 1.0920. Price pushes to 1.0928 and prints a full body close above the level on the 15-minute chart. Price pulls back to 1.0918, retests the broken resistance (now support), and forms a higher low at 1.0915. The 5-minute chart shows a market structure shift with a higher high breaking the last swing high. Entry at 1.0922, stop below the retest low at 1.0910 (12 pips), target at the next supply zone at 1.0970 (48 pips).
Risk: 0.5 lots on a $10,000 account.
The confirmed entry risked $60 for a potential $240 return. The fake breakout in the earlier example cost the trader $200 with no plan. The confirmation rule does not guarantee wins, but it filters out the traps that drain accounts.
Inducement Traps: Pull and Push Moves
Not all fake breakouts look the same. Some are inducement traps, where price deliberately pulls traders into a position before reversing.
A pull inducement works like this: price creates what looks like a market structure shift. Traders enter on the shift. Then price reverses deeper, sweeping their stops before the real move begins. The initial "shift" was fake. It was inducement.
A push inducement is the opposite. Price pushes aggressively past a level, creating urgency. Traders chase the move because it looks like momentum. Then price snaps back, trapping them.
Both setups share one feature: they target obvious levels where retail traders place orders. Equal highs. Equal lows. Previous swing points. If you can see the level easily, so can the market.
The fix is patience. After you see what looks like a breakout or a shift, wait for the next structural confirmation. If the first move was inducement, the real move will form its own setup at a deeper level. You miss the first entry, but you avoid the trap.
How EdgeFlo Tracks Breakout vs Trap Results
The only way to know whether your breakout trades are profitable is to track them separately from your other setups. If you lump everything together, you cannot see the pattern.
EdgeFlo's trading journal tracks win rate by setup type. Tag your entries as "breakout" or "fakeout recovery" and review the data after 20 or more trades. You might discover that your breakout entries have a 30% win rate while your confirmation entries have a 55% win rate. That data tells you exactly which approach to keep and which to cut.
The journal also lets you tag the emotional state at entry. Were you patient, or were you chasing? Over time, that tag alone reveals whether your losing breakout trades were process failures or genuine market randomness.
What is a fake breakout in trading?
How can I tell if a breakout is real or fake?
Why do fake breakouts happen so often?
Should I trade fake breakouts or avoid them?

Turn discipline on.
Every session.
EdgeFlo is the environment serious traders operate inside.
Start 7-Day Trial — $7
Cancel anytime.
No long-term commitment.


Think Different, Trade Different.