

How to Build a Mechanical Trading Plan (4 Pillars)
Build a mechanical trading plan using four pillars: entry criteria, exit rules, trade management, and risk management. Stop trading on emotion.

A mechanical trading plan is a written rulebook that answers every decision you face during a trade, from entry to exit, before you open a chart. It removes emotion from the equation by replacing gut feelings with predefined rules. If the setup meets your criteria, you take the trade. If it does not, you stay out. No hesitation, no guesswork.
Most traders lose for one of three reasons: they have no plan, they have one but do not follow it, or the plan itself is poorly built. This guide covers the four pillars that make a plan complete and worth following.
TL;DR
A mechanical trading plan has four pillars: entry criteria, exit rules, trade management, and risk management.
Every decision you face during a trade should already be answered in writing before the market opens.
Mechanical rules let you track, measure, and refine your edge over time, which is impossible with emotion-based trading.
Losses still happen, but they become planned business expenses instead of emotional blowups.
Aim for 90% mechanical and 10% discretionary to keep the plan adaptable as markets evolve.
What a Mechanical Plan Actually Contains
A mechanical plan is not a strategy cheat sheet. It is a document that covers every scenario you will encounter from the moment you sit down to trade until you close your platform.
Think of it this way. When the market opens, hundreds of questions hit you at once. Where should you buy? What price is ideal? Limit order or market order? Where does the stop loss go? How do you handle the position once it is open? Without a plan, you answer each question with whatever feels right in the moment. And "whatever feels right" changes depending on whether your last trade won or lost.
A mechanical plan answers all of those questions in advance. It breaks down into four pillars:
Entry criteria (when and where to get in)
Exit rules (when and where to get out, win or lose)
Trade management (how to handle the position while it is open)
Risk management (how much to risk and when to stop)
When all four are defined, you know exactly what to do from the start of the trading day to the end. No improvisation required.
The difference between this and trading rules scribbled on a sticky note is specificity. Every line in your plan should be concrete enough that someone else could follow it and take the same trades you would.
Entry Criteria: Define Before You Trade
Your entry criteria answer one question: what needs to happen on the chart before you click buy or sell?
Most traders skip this step. They see a candle pattern they like, or price is "near" a level, and they enter. That is discretionary trading. You end up taking different kinds of setups every day, which makes it impossible to measure whether your approach actually works.
Instead, write down each piece of your entry process:
Market structure mapping. Which time frame do you use to identify the trend? The 4-hour? The daily? Define the structure: bullish break of structure, bearish break of structure, pullback phase versus push phase.
Time frame for execution. Scalpers might enter on the 1-minute or 5-minute chart. Swing traders might use the 1-hour or 4-hour. Pick one and stick with it.
Point of interest. You enter when price reaches a specific zone, not when it is floating in the middle of nowhere. Is that zone a supply or demand area? An order block? Does it need to have swept liquidity first?
Entry trigger. Are you entering at the edge of the zone, the 50% equilibrium, or the extreme end? What confluence confirms the entry? A market structure shift? An inducement sweep?
Write every detail down. If you cannot describe your entry in a single paragraph that another trader could follow, it is not mechanical enough.
Here is what a good pre-trade checklist entry looks like versus a bad one:
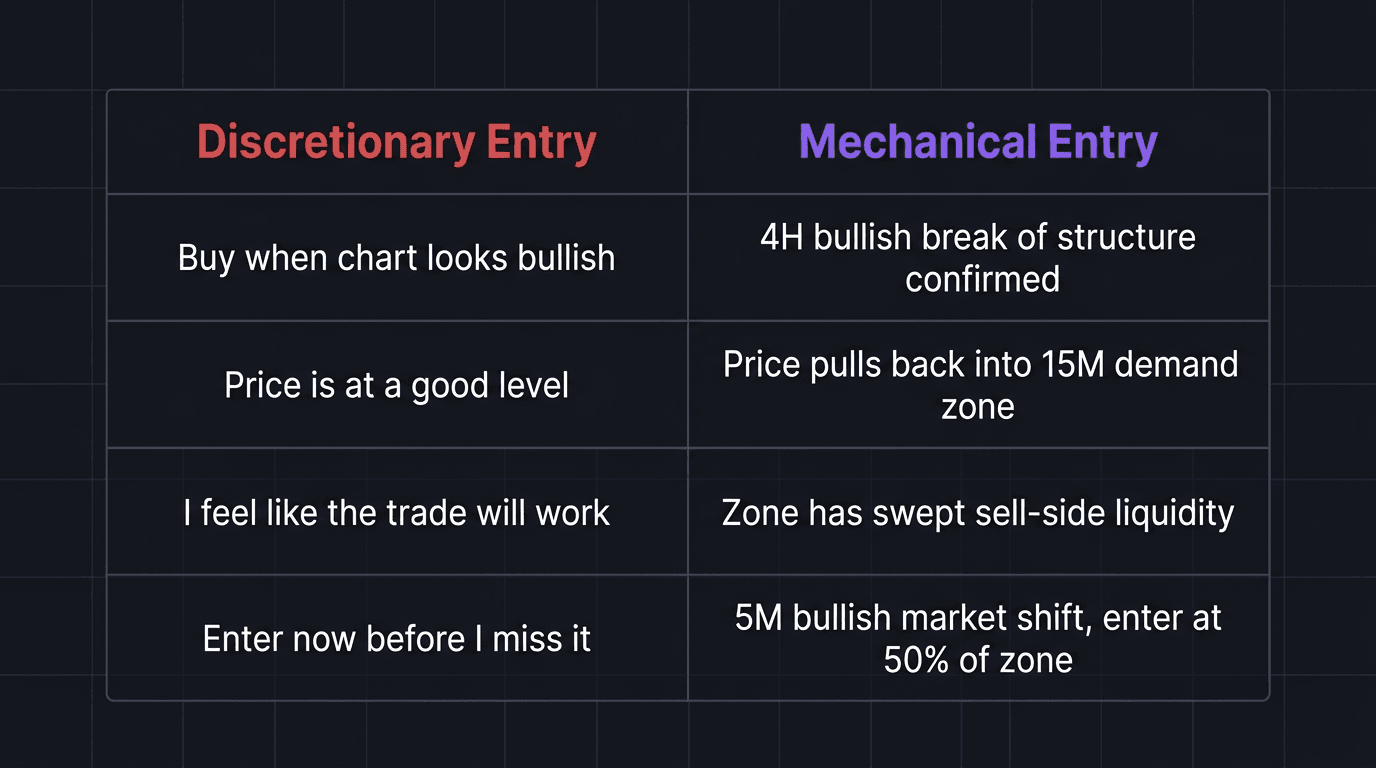
Bad: "Buy when the chart looks bullish and price is at a good level."
Good: "Buy when the 4-hour chart shows a bullish break of structure, price pulls back into a demand zone on the 15-minute chart, the zone has swept sell-side liquidity, and I see a bullish market structure shift on the 5-minute chart. Enter at the 50% of the new demand zone."
The second version can be backtested. The first cannot.
Exit Rules: Stop Loss and Take Profit
Exit rules answer two questions. Where do you get out when the trade goes wrong? And where do you get out when the trade goes right?
Most traders define entries but leave exits vague. They "see how it goes." That leads to two problems: cutting winners short because you are scared of losing open profit, and letting losers run because you hope price will come back.
Stop Loss Placement
Your stop loss should go behind a structural level, not at a random number of pips. Common placements:
Behind the supply or demand zone your entry is based on
Behind the nearest swing high (for sells) or swing low (for buys)
Then define the buffer. How many pips behind that level? Two pips is the minimum to account for spread. Some traders use 3, 5, or 10 depending on the pair and time frame. Pick a number and use it every time.
Take Profit Placement
You have two main options for exit strategy:
Fixed R method. If your stop loss is 20 pips, and you target 3R, your take profit is 60 pips from entry. You get out regardless of what price is doing at that level. Clean, simple, easy to track.
Technical targets. You exit at the next supply or demand zone, or the next swing high or low. This method is slightly more subjective, but it can capture bigger moves when structure is favorable.
Walkthrough: Fixed R Exit on EUR/USD
You enter a buy on EUR/USD at 1.0850 with your stop loss 20 pips below at 1.0830. You use a 3R target. Your take profit sits at 1.0910 (60 pips above entry). Price hits 1.0910 and you close. The trade is done.
Math check: 1 standard lot = $10/pip. 0.5 lots = $5/pip. $5 times 20 pips = $100 risk. $5 times 60 pips = $300 target. $300 / $100 = 3R.
Entry 1.0850 to stop 1.0830 = 20 pips. Entry 1.0850 to target 1.0910 = 60 pips. All checks pass.
When your exit rules are set, price blowing past your take profit no longer causes regret. You followed the plan. And if your stop gets hit and price reverses, you know exactly what to adjust next time (wider stop, different zone, more buffer).
Trade Management: How You Handle Open Positions
Trade management is what happens between entry and exit. This is where most traders bleed money, because they make emotional decisions while watching their open position tick up and down.
Define your management method before you trade. There are three common approaches:
Set-and-forget. Place your entry, stop, and target. Walk away. Do not touch the trade. This is the simplest method and works well if you struggle with micromanaging. You can read more about set-and-forget trading.
Trailing stop loss. Move your stop loss to lock in profit as price moves in your favor. Define the rules: you trail behind the most recent swing high or low, a specific number of pips behind, on a specific time frame.
Partial profits. Close part of your position at a predetermined level and let the rest run. Define: at what level do you take partials? How much volume do you remove? 50%? 30%?
The key word is "define." If you wake up tomorrow and feel like trailing your stop, but yesterday you used set-and-forget, you are not trading mechanically. You are guessing. And guessing produces inconsistent results, the kind of equity curve that looks like a heartbeat monitor instead of a steady uptrend.
Your management rules should specify:
Which method you are using
Exact time frame for your stop and target
Exact trailing distance (in pips, behind which structure)
Exact partial profit levels and volume percentages
Risk Management: The Non-Negotiable Pillar
Risk management is the pillar that keeps you alive. You can have perfect entries, exits, and management, but if you risk too much per trade, a losing streak will wipe you out before your edge has time to play out.
Here is the uncomfortable truth: you cannot play if you run out of chips. Capital preservation is not a bonus. It is the prerequisite for everything else.
Your risk management rules should answer:
Risk per trade. 1% or 2% of your account. Pick one. Use it every single time. If you need help calculating the right amount, risk per trade breaks down the math.
Position sizing. Once you know your risk percentage and stop loss distance, use a position size calculator. Enter the numbers, get the lot size. No guessing.
Scale-in risk. If you add to a position, how much are you risking on the second entry? Still 1%? Or half, at 0.5%? Define it.
Maximum account exposure. How much total drawdown are you willing to accept before you stop trading? For many traders, 5% is the ceiling.
Max daily loss. Set a hard cap on how much you can lose in a single day. Two or three losing trades in a row and you are done for the day. This prevents revenge trading and overtrading during losing streaks.
Walkthrough: Risk Calculation Gone Wrong
A trader has a $10,000 account and risks 2% per trade ($200). After three consecutive losses, they are down $600 (6% drawdown). Frustrated, they skip the daily loss limit and double their risk to 4% to "make it back." The next trade loses. That is another $400 gone, totaling $1,000 or 10% of the original account.
Math check: 3 losses at 2% = 6% drawdown. $10,000 times 6% = $600. 1 loss at 4% = $400. Total drawdown = $600 + $400 = $1,000. $1,000 / $10,000 = 10%.
If the daily loss cap was 4% ($400), the trader would have stopped after two losses and protected $600.
That example is not extreme. It is the most common way traders blow accounts. The fix is simple: set the cap, follow it, and walk away when you hit it.
How EdgeFlo Supports Your Mechanical Plan
Building a mechanical plan is one step. Following it under pressure is another. EdgeFlo is built to keep your rules visible while you trade, so the plan does not live in a forgotten notebook.
With EdgeFlo's Edge feature, you can document your strategy, set it as your active plan, and run post-trade self-reporting against it. After each trade, you check whether you actually followed the rules. That feedback loop is what turns a plan on paper into trading consistency in practice. The trade plan builder helps you define, store, and standardize your rules so they are always one click away.
For risk management, EdgeFlo's guardrails warn you when you approach your daily loss limit. You can override them (the choice is always yours), but you have to consciously decide to break the rule. That friction is the difference between an impulsive revenge trade and a deliberate decision.
What is a mechanical trading plan?
How many pillars does a mechanical plan need?
Can a mechanical plan still lose trades?
Should a trading plan be 100% mechanical?

Turn discipline on.
Every session.
EdgeFlo is the environment serious traders operate inside.
Start 7-Day Trial — $7
Cancel anytime.
No long-term commitment.


Think Different, Trade Different.