

How to Build a Higher-Timeframe Narrative Before Every Trade
Build a higher-timeframe narrative in 5 minutes by answering five questions about trend, range, zones, and liquidity. Filter every lower-timeframe entry.

Every losing trade you take on the 15-minute chart started with the same mistake: you never checked what the daily was doing. A higher-timeframe narrative is a five-minute story you build before touching a lower timeframe. It tells you who controls price, where the key zones sit, and which direction gives you the highest probability of success. Without it, you are guessing.
TL;DR
A higher-timeframe narrative is a quick daily or 4-hour chart analysis that sets your directional bias before every session.
Answer five questions: trend direction, active range, premium vs discount, key zones, and resting liquidity.
Mark the current swing high and swing low to define the range you are trading inside.
Only take lower-timeframe entries that align with the higher-timeframe story.
Spend five minutes on this before every session and watch how many bad trades disappear.
What Is a Higher-Timeframe Narrative
A higher-timeframe narrative is a short, structured read of the daily or 4-hour chart that answers one question: what is the bigger picture doing right now?
Think of it like reading the weather before leaving the house. You would not check if it is raining by looking through your bedroom window only. You check the forecast for the whole day. Your higher-timeframe narrative does the same thing for price.
It starts with identifying the current trend. Is price making higher highs and higher lows, or lower highs and lower lows? Then you identify the active range (the most recent swing high and swing low that price is trading between). Finally, you note where the important supply and demand zones sit inside that range.
This is not a deep analysis. It is a quick read. Five minutes, five questions, and you have a filter that removes half the bad setups you would otherwise take.
What It Is Not
A narrative is not a prediction. You are not saying "price will go to 1.0950 today." You are saying "price is bullish inside this range, trading in the discount zone, and I will only look for buys near this demand level." That distinction matters. Predictions create attachment. Narratives create filters.
The Five Questions Your Narrative Must Answer
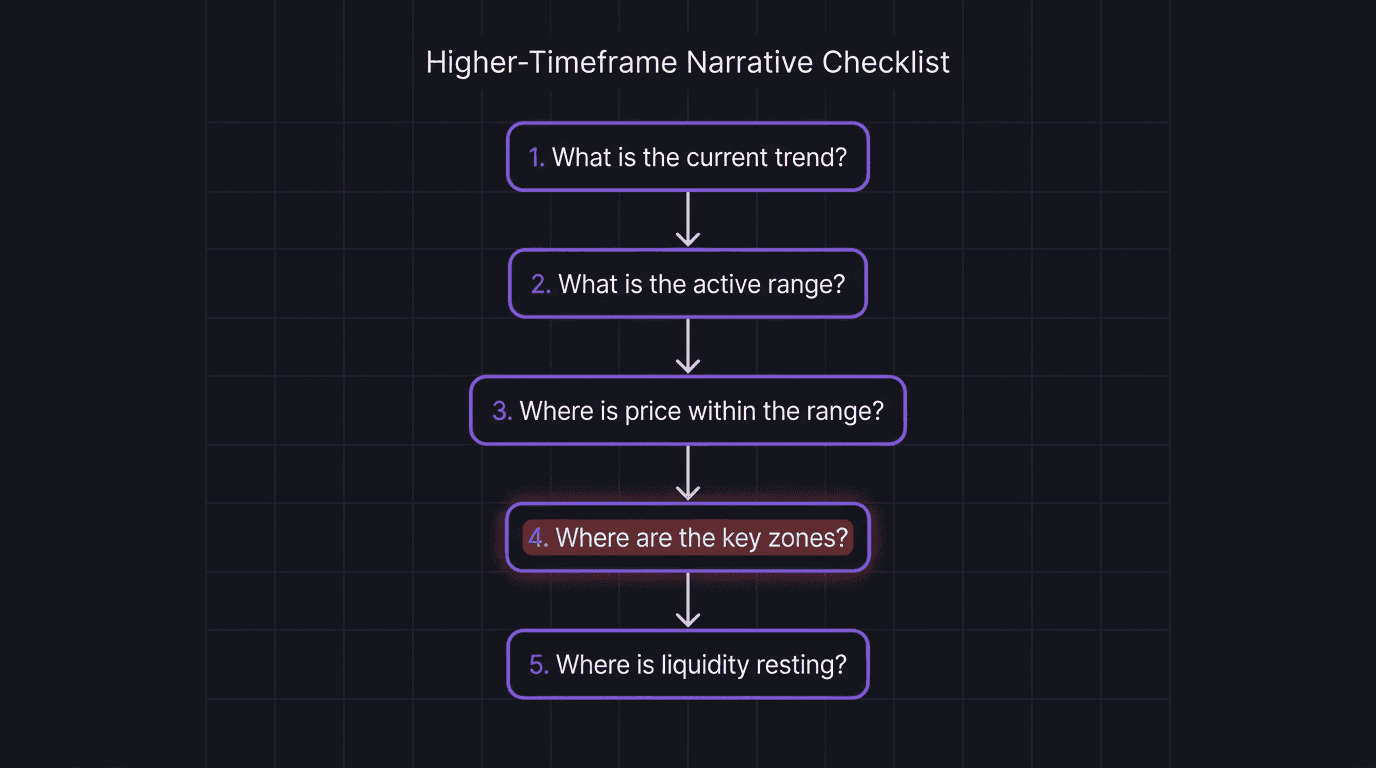
Every higher-timeframe narrative answers the same five questions. Miss one and your filter has a hole.
1. What is the current trend? Look at the most recent swing structure. Higher highs and higher lows means bullish. Lower highs and lower lows means bearish. If structure is mixed, you are in consolidation and your narrative should reflect that (trade with caution or sit out).
2. What is the active range? Identify the most recent swing high and swing low. Price is trading between these two levels. Everything you do on the lower timeframe happens inside this box. If price breaks out of the range, your narrative changes.
3. Where is price within the range? Is it in the premium zone (above 50%) or the discount zone (below 50%)? In a bullish trend, you want to buy from the discount zone. In a bearish trend, you want to sell from the premium zone. If price is sitting at the 50% equilibrium, you may want to wait for it to push into a more favorable zone before acting.
4. Where are the key zones? Mark the demand zones, supply zones, and any flip zones (areas where demand turned into supply or vice versa) inside the range. These are where price is most likely to react. Your lower-timeframe entries should happen at or near these levels.
5. Where is liquidity resting? Liquidity collects above swing highs and below swing lows. These clusters are magnets. If you see a stack of equal highs sitting just above your demand zone, expect price to sweep that liquidity before reversing. This single detail saves you from getting stopped out on perfectly good setups.
Marking Premium, Discount, and Key Zones
Once you know the active range, split it in half. The top half is the premium zone. The bottom half is the discount zone. The dividing line is the equilibrium, or 50% level.
This is mechanical. Take the swing high, take the swing low, find the midpoint. No judgment required.
Here is where it gets useful. In a bullish trend, you only want to enter from the discount zone. Why? Because buying in the discount gives you the most room to run toward the swing high, and it keeps your stop loss tight below the swing low.
Walkthrough: EUR/USD Daily Narrative
You open the daily chart and see EUR/USD made a swing low at 1.0750 and a swing high at 1.0950. The range is 200 pips. The equilibrium sits at 1.0850. Price is currently at 1.0800, which is in the discount zone. The trend shows higher highs and higher lows. There is a demand zone between 1.0760 and 1.0780 that formed after the last bullish break of structure. Liquidity is resting below the equal lows at 1.0740.
Your narrative: "Bullish trend. Price is in the discount zone. I will look for buy entries at the demand zone between 1.0760 and 1.0780, but I expect a liquidity sweep below 1.0740 first. I will not short inside this range."
That took three minutes. Now every 15-minute setup you see gets filtered through this context.
Sound familiar? You have probably taken shorts on the 15-minute chart while the daily was screaming bullish, just because the lower timeframe "looked bearish." The narrative prevents that.
How the Narrative Filters Lower-Timeframe Entries
Your daily bias is the output of the narrative. Once it is set, the lower timeframe becomes simple: you only look for setups that agree with the story.
Here is what that looks like in practice. You built a bullish narrative on the daily. You drop to the 1-hour chart and see price approaching your daily demand zone. You then drop to the 15-minute chart to find your entry model. If the 15-minute shows a bullish break of structure at the demand zone, you have alignment across all three timeframes. That is a trade.
If the 15-minute shows bearish structure at the demand zone? You wait. The narrative says buy, but the lower timeframe has not confirmed. Patience is part of the filter.
Walkthrough: Filtered Entry on GBP/USD
Your daily narrative on GBP/USD is bullish. The active range runs from 1.2600 (swing low) to 1.2800 (swing high). Price is at 1.2650, sitting in the discount zone. You have a demand zone between 1.2610 and 1.2630.
You drop to the 1-hour chart and see price pulling back toward the demand zone. You switch to the 15-minute. Price sweeps the liquidity below 1.2610, taps into the demand zone, and then creates a bullish break of structure at 1.2625.
You enter long at 1.2625 with a stop loss at 1.2600 (25 pips below). Your target is the swing high at 1.2800 (175 pips above).
Math check: 1 standard lot on GBP/USD = $10/pip. 25 pips risk = $250 risk. 175 pips target = $1,750 target. $1,750 / $250 = 7R.
That is a 7:1 risk-to-reward trade that only appeared because the narrative said "buy in the discount, near this demand zone, after a liquidity sweep." Without the narrative, you might have shorted the pullback instead.
When to Update Your Narrative
Your narrative is valid until the range breaks. If price closes above the swing high or below the swing low, the range is broken and you need a new narrative. Some traders rebuild their narrative every morning. Others rebuild it only when structure changes. Either approach works, but the narrative must stay current.
If you are a swing trader, you might use the weekly chart as your higher timeframe and the daily as your medium. The process is identical. Only the timeframes shift.
How EdgeFlo Documents Your Daily Narrative
Building a narrative is only half the job. Recording it so you can review whether your reads were accurate is the other half.
EdgeFlo's Edge plan builder (available on Plus) lets you document your mechanical trading plan rules, including your higher-timeframe narrative framework. You can define the specific questions you answer each morning and store the criteria that must be true before you look for entries. When you complete your post-trade review, you can compare what your narrative predicted against what actually happened.
This creates a feedback loop. Over 50 or 100 trades, you start seeing whether your narratives are consistently accurate or whether certain conditions (consolidation ranges, news-driven spikes) throw off your reads. That kind of data turns a vague habit into a measurable skill.
Your multi-timeframe analysis becomes repeatable when you write it down. And repeatable processes are the only ones that compound.
What is a higher-timeframe narrative in trading?
How long does it take to build a higher-timeframe narrative?
Should swing traders build a narrative differently than day traders?
What happens if I skip the higher-timeframe narrative?

Turn discipline on.
Every session.
EdgeFlo is the environment serious traders operate inside.
Start 7-Day Trial — $7
Cancel anytime.
No long-term commitment.


Think Different, Trade Different.