

V-Shape Reversal: Score Every Sweep Reaction
A V-shape reversal after a liquidity sweep confirms smart money stepped in. Score sweep reactions in your journal so you can grade setup quality over time.

Price dips below the swing low, grabs the liquidity, and snaps back up in a single candle. That sharp rejection is a V-shape reversal, and it is one of the strongest confirmation signals that institutions just stepped in.
But not every V-shape is equal. Some lead to 100-pip moves. Others barely retrace before failing. The difference between the two is not obvious in the moment, but it becomes obvious in your journal after 50 samples.
TL;DR
A V-shape reversal happens when price sweeps a liquidity level and immediately rejects, forming a sharp V pattern on the chart.
The V-shape confirms that institutions used the swept liquidity to fill orders and push price in the opposite direction.
Score every V-shape reaction on three criteria: sweep depth, rejection speed, and structure break.
Logging scored reactions in your trading journal builds a data set that shows you which V-shapes are worth trading and which are traps.
Over time, your scoring data tells you exactly what a "good" reaction looks like for your specific setups.
What Makes a V-Shape Reversal Different
Most reversal patterns in textbooks are gradual. Double bottoms take time to form. Head and shoulders patterns require multiple swings. Rounded bottoms develop over sessions or days.
A V-shape is none of that. It is fast, aggressive, and usually completes within one to three candles. Price pushes past a key level, triggers the resting orders (stop losses and pending entries), and immediately reverses with a large momentum candle.
The speed matters. A slow reversal after a sweep means price is still deciding. Buyers and sellers are wrestling. But a V-shape means one side overwhelmed the other instantly. When that happens after a liquidity sweep, it means the institution that needed those resting orders got what they wanted and started pushing price in their direction.
That is the confirmation: swept liquidity plus immediate rejection equals institutional entry. Everything else, the zones, the trend, the timing, set the table. The V-shape is the signal that someone actually sat down to eat.
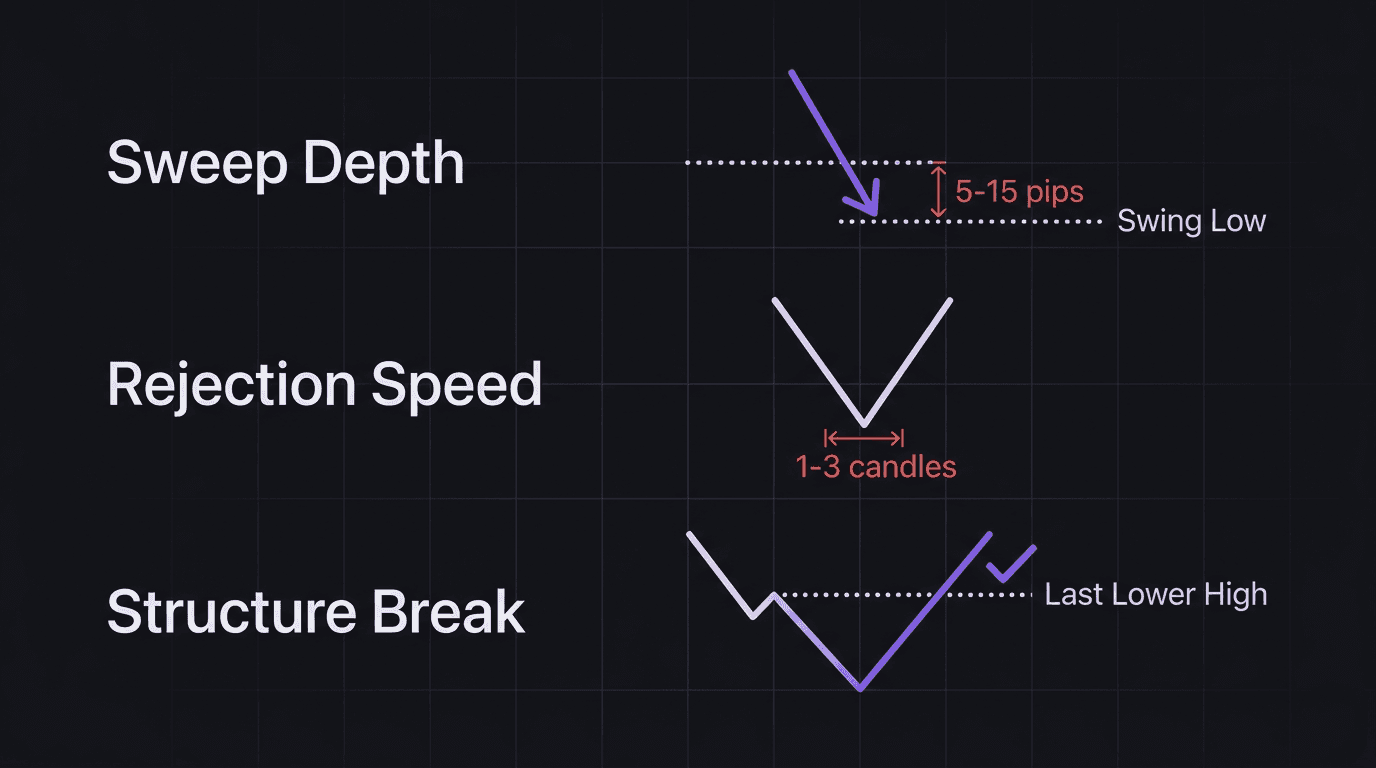
The Three Components of a V-Shape
Not all V-shapes look the same, and not all of them lead to profitable trades. Breaking the reaction into three measurable parts gives you something concrete to track.
1. Sweep Depth
How far did price push past the liquidity level? A deep sweep (price pushing 10 to 20 pips past a swing low) usually triggers more stops and generates more fuel than a shallow one (price barely touching the level).
However, extremely deep sweeps can be a warning. If price blows through a level by 30 or 40 pips, it might not be a sweep at all. It might be genuine momentum in that direction.
The sweet spot for most forex pairs on the 15-minute chart is a sweep that extends 5 to 15 pips past the obvious liquidity level.
2. Rejection Speed
How quickly did price snap back? Count the candles. A one-candle rejection (the sweep wick and the reversal happen on the same candle) is the strongest signal. A two- or three-candle rejection is still valid but carries less conviction.
If price sweeps a level and then sits there for five or six candles before reversing, that is not a V-shape. That is a potential accumulation or distribution zone, which is a different pattern entirely.
3. Structure Break
After the V-shape forms, does the reversal actually break internal structure? This is the final confirmation.
If price sweeps a swing low and snaps back up (V-shape), you want to see it break above the most recent lower high. That break confirms that the internal bearish structure has shifted and the pullback (or reversal) is likely real.
Without the structure break, you have a reaction but not a confirmed change of direction. Some V-shapes bounce and then continue in the original trend. The structure break separates the real reversals from the dead-cat bounces.
How to Score a V-Shape in Your Journal
Every time you see a V-shape reaction (whether you traded it or not), log it in your journal with a simple scoring system.
Sweep depth: 1 point for shallow (under 5 pips past the level), 2 points for moderate (5 to 15 pips), 3 points for deep (15+ pips but not excessive).
Rejection speed: 1 point for slow (4+ candles), 2 points for moderate (2 to 3 candles), 3 points for fast (1 candle).
Structure break: 0 points if no break, 2 points if internal structure broke within 3 candles of the V-shape.
Maximum score: 8 points. Anything scoring 6 or above is a high-quality reaction. A score of 4 to 5 is tradable but with caution. Below 4, the reaction likely is not worth entering.
Walkthrough: Scoring a Real V-Shape
Pair: EUR/USD. 15-minute chart during the London open. The higher timeframe trend is bullish. Price has been consolidating during the Asian session with a swing low at 1.0850. Sell stops are sitting below 1.0850.
At 3:10 AM EST, price drops to 1.0840, sweeping 10 pips below the swing low. A large bullish candle forms immediately, closing at 1.0868. Within one more candle, price breaks above the last internal lower high at 1.0862.
Sweep depth: 10 pips past the level. Moderate. 2 points.
Rejection speed: The sweep and reversal happened across one candle. Fast. 3 points.
Structure break: Price broke above 1.0862 (last lower high) within 2 candles. 2 points.
Total: 7 out of 8. High-quality reaction.
This is the kind of V-shape that consistently leads to continuation of the higher timeframe trend. In this case, price ran 60 pips to the upside over the next three hours.
Walkthrough: Scoring a Weak V-Shape (What Not to Trade)
Same pair, different day. The higher timeframe is bearish. Price pushes above a swing high at 1.0920, reaching 1.0924 (only 4 pips past the level). The reversal takes 5 candles to develop, with price hovering near 1.0920 for 20 minutes before slowly dropping. Internal structure (the last higher low) does not break.
Sweep depth: 4 pips. Shallow. 1 point.
Rejection speed: 5 candles. Slow. 1 point.
Structure break: No break. 0 points.
Total: 2 out of 8. Not tradable.
This reaction looks like a sweep on the surface, but the scoring reveals it lacked conviction. Price eventually drifted sideways for another hour before the real move happened elsewhere.
Logging this in your journal is just as valuable as logging the winner. After 30 to 50 scored reactions, patterns emerge. You will see that your winning trades almost always come from reactions scoring 6 or higher. Your losses cluster around scores of 3 to 5. That data turns a subjective "it looked good" into an objective filter.
Building Your Reaction Database
The real power of scoring V-shapes is not in any single trade. It is in the data set you build over weeks and months.
Start a simple table in your journal or spreadsheet:
Date | Pair | TF | Sweep Level | Depth | Speed | BOS? | Score | Traded? | Outcome |
|---|
After 50 entries, filter for scores of 6 and above. What is the win rate? What is the average R on those trades? Now filter for scores below 4. How many of those turned into winners?
Most traders who do this discover that their high-scoring reactions win at 55% to 65%, while low-scoring ones win at 30% or less. That single insight is enough to transform your entry selection.
This is what makes journaling a feedback loop instead of a homework assignment. You are not writing for the sake of writing. You are building a database that tells you, with your own data, which reactions are worth risking money on.
Common Mistakes When Trading V-Shapes
Entering before the V-shape completes. Price dips below a swing low, and you enter long immediately, hoping for the snap. But the snap does not come. Price keeps dropping. Wait for the reversal candle to close before acting.
Ignoring the structure break. A V-shape without a structure break is just a bounce. Many traders enter on the V and get stopped out when price resumes the original trend. The structure break is what separates "something happened" from "direction has actually changed."
Trading V-shapes against the higher timeframe trend. A V-shape after a sweep at a swing high in a strong uptrend is likely just the continuation pulling back. It is not a short signal. The V-shape must align with your overall trade review process and higher timeframe bias.
Not logging reactions you skipped. If you see a V-shape but decide not to trade it, log it anyway. When you review your journal, you need to see what you missed. Sometimes the best trades are the ones you saw, scored, and did not take. That is information you can act on.
Why Scored Reactions Change How You Review
Most post-trade reviews focus on what happened after the entry. Did you manage the trade well? Was your stop correct? Did you exit at the right time?
Scoring the reaction adds a layer before the entry. It asks: should you have entered at all? When you review a losing trade and see that the reaction scored a 3, the lesson is not about trade management. The lesson is about entry selection. You took a low-quality reaction and treated it like a high-quality one.
This is the difference between a good loss and a bad loss. A good loss comes from a 7-scoring reaction that happened to not work out. A bad loss comes from a 3-scoring reaction you entered anyway because you were bored.
Over time, your scoring system trains your eye. You start recognizing high-scoring reactions in real time, without needing to calculate each component. The journal work you did in the past becomes intuition in the present.
How EdgeFlo Supports Reaction Scoring
EdgeFlo's AI-powered trading journal auto-imports your trades, so the data entry friction disappears. You do not need to manually log the pair, entry price, exit price, and result. That is already captured.
What you add is the reaction score. After each trade (or each observed V-shape), tag the entry with your sweep depth, rejection speed, and structure break score. Over time, EdgeFlo's weekly AI report (Plus) can surface patterns in your scored entries, showing you which score ranges correlate with your best outcomes.
Emotion tagging adds another dimension. Did you enter a 3-scoring reaction because you felt fear of missing out? That tag, combined with the score, gives you a precise diagnosis. Not "I need to be more patient" (vague), but "I enter low-scoring reactions when my FOMO tag is active" (specific, fixable).
The Edge Brief
Receive Insights on trading psychology, discipline, and the behavioral patterns that create consistent traders from our Founder and the EdgeFlo team, delivered to your inbox.
Think different. Trade different.
What is a V-shape reversal in trading?
How do you score a V-shape reaction in your journal?
Does every liquidity sweep produce a V-shape reversal?
Why should I journal V-shape reactions I did not trade?

Turn discipline on.
Every session.
EdgeFlo is the environment serious traders operate inside.
Start 7-Day Trial — $7
Cancel anytime.
No long-term commitment.


Think Different, Trade Different.