

The Inflection Point: When Trading Growth Becomes Exponential
Trading growth is exponential, not linear. Most traders quit during the flat phase right before the curve bends. Learn how to measure progress before profits arrive.

Trading growth is not linear. It is exponential. That means the first one, two, or even five years can feel like you are going nowhere. The equity curve is flat. The P&L bounces between small wins and small losses. Progress feels invisible.
Then something shifts. The patterns you have seen a thousand times start resolving faster. The emotional triggers that used to wreck your week barely register. The trades you take become cleaner, your exits sharper, your risk management automatic. The curve bends upward, and the results that felt impossible six months ago start arriving regularly.
Most traders quit right before that bend. This article is about recognizing where you are on the curve, measuring progress when profits are not showing it yet, and staying in the game long enough for compounding to work.
TL;DR
Trading skills compound like interest: invisible early, explosive later.
The inflection point arrives after consistent practice, journaling, and risk discipline stack up over hundreds of trades.
Quitting during the flat phase means walking away right before the curve accelerates.
Process metrics (plan adherence, average R, discipline consistency) show improvement before P&L does.
A dashboard that tracks more than just profit reveals the inflection point while you are still in it.
The Invisible Progress Problem
If you planted a tree and checked on it every hour, you would never see it grow. But after a year, the trunk is thicker, the roots deeper, the canopy wider. Trading works the same way.
The skills that make a trader profitable are not the kind that produce instant results. Pattern recognition builds through thousands of chart observations. Emotional control develops through hundreds of losing trades handled correctly. Risk discipline becomes automatic only after dozens of sessions where you wanted to break the rules and chose not to.
None of that shows up on a P&L statement until it accumulates past a critical mass. The trader who has been journaling for six months and still breaking even is not failing. They are building. The problem is that "building" feels exactly like "going nowhere" when you only measure results in dollars.
How Skills Compound Like Interest
Consider compound interest. If you invest $1,000 at 10% annual return, year one gives you $100. Unimpressive. Year five gives you $161 on a balance of $1,610. Year ten: $259 on $2,594. The early years are boring. The later years are dramatic. Same rate of return the entire time.
Trading skill compounding works similarly. Each trade you journal, each mistake you identify, each emotional trigger you learn to manage adds a small percentage to your overall competence. In the first year, those small percentages feel meaningless. By year three, they have stacked into a fundamentally different trader.
The critical insight: the rate of improvement does not change. What changes is the base it compounds on. A trader with 500 trades of journaled data improves faster from trade 501 than a trader with 50 trades improves from trade 51, because the pattern library is deeper and the self-awareness is sharper.
This is why long-term trading mindset matters more than any single strategy. The strategy can change. The commitment to compounding cannot.
Why Most Traders Quit Right Before the Curve Bends
The exponential curve has a cruel feature: the flat part looks identical to failure. A trader who is genuinely improving but has not yet reached the inflection point produces the same P&L as a trader who is going nowhere. Both are roughly breakeven, maybe slightly negative.
The difference is invisible from the outside but real in the data. The improving trader has a rising plan adherence rate. Their average losing trade is getting smaller. Their emotional revenge trades are dropping from three per week to one per month. Their trading expectancy is trending from negative toward zero, on its way to positive.
The stagnant trader has none of those trends. Same mistakes, same emotional triggers, same deviation from the plan, month after month.
Both traders look the same on a P&L screenshot. But only one of them is six months from the inflection point. The other will still be in the same spot a year from now.
Walkthrough: Two Traders, Same P&L, Different Trajectories
Trader A and Trader B both have $5,000 accounts. Both are roughly breakeven after 12 months.
Trader A's journal shows: plan adherence improved from 60% to 88%. Average loser shrank from 1.2R to 0.85R. Revenge trades dropped from 4 per month to 0.5 per month. Average winner grew from 1.5R to 2.1R.
Trader B's journal shows: plan adherence is 65% (same as six months ago). Average loser is 1.3R (same). Revenge trades: 3 per month (same). No journal entries for the last 45 days.
Same account balance. Radically different trajectories. Trader A is building toward an inflection point. Trader B is running on a treadmill.
This is why tracking consistency metrics matters. The P&L does not tell you whether you are improving. The process data does.
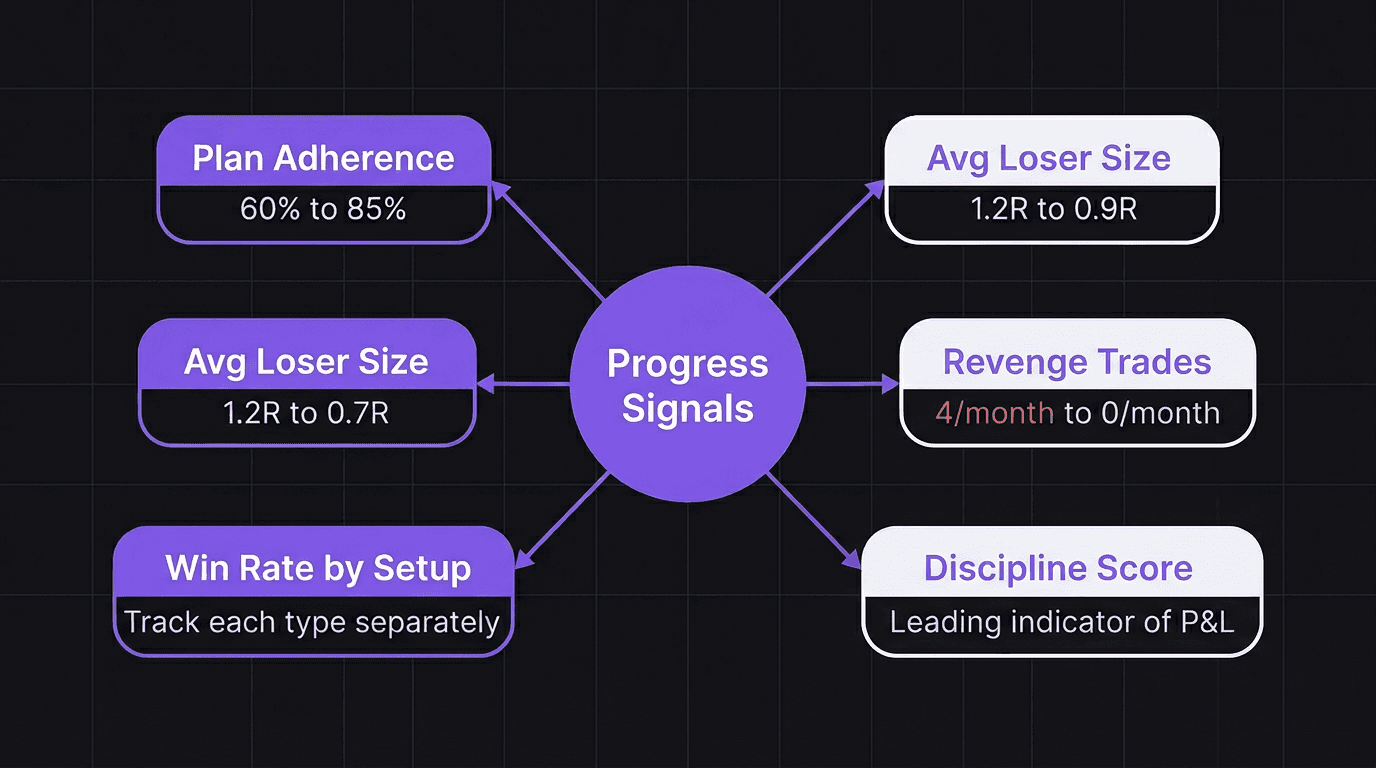
Measuring Progress When P and L Is Flat
If you only look at your account balance, you will miss the signals that growth is happening. Here are the metrics that reveal progress before profits arrive:
Plan adherence rate. What percentage of your trades followed every rule in your plan? A trader going from 60% adherence to 85% is making dramatic progress even if the bottom line has not moved yet.
Average R on losers. Are your losing trades getting cheaper? A shift from 1.2R average loser to 0.9R means you are cutting losses faster, which directly improves expectancy.
Revenge trade frequency. How often do you take a trade outside your plan after a loss? This number should trend toward zero over time.
Win rate by setup type. Are certain setups improving while others stay flat? That tells you where to double down and what to cut.
Discipline score. A composite measure of whether you followed your pre-trade checklist, sized correctly, managed the trade according to plan, and journaled the result. The equity curve of your discipline score is often a leading indicator of the equity curve of your P&L.
How EdgeFlo Dashboard Shows Growth Beyond Profit
Standard trading dashboards show win rate, total profit, and maybe a basic equity curve. Those metrics only tell you about the output. They say nothing about the process that creates it.
EdgeFlo's dashboard tracks EdgeScore and discipline summary alongside the standard P&L metrics. EdgeScore reflects the quality of your execution (did you follow your plan, size correctly, manage the trade properly), which is a process metric, not just an outcome metric.
That distinction matters enormously during the flat phase. A trader whose EdgeScore is climbing from 65 to 80 over three months is clearly improving, even if the P&L has not caught up yet. That climbing score is the inflection point happening in real time, visible in the data before it shows up in the account balance.
The weekly AI report (Plus) adds another layer by surfacing trends across your last 30, 60, or 90 trades. It might flag that your London session trades have improved 15% in the last month, or that your average hold time on winners has increased, suggesting better trade management. Those are the compound interest payments accumulating before the big payout.
Staying in the game through the flat phase requires trading longevity, and longevity requires proof that the work is accumulating even when the balance sheet is quiet. The right dashboard provides that proof.
How long before trading skills start to compound?
Why does trading feel like no progress for so long?
How do I know if I am improving as a trader?
Should I quit trading if I am not profitable after two years?

Turn discipline on.
Every session.
EdgeFlo is the environment serious traders operate inside.
Start 7-Day Trial — $7
Cancel anytime.
No long-term commitment.


Think Different, Trade Different.