

Trading Consistency Metrics That Expose Drift
Trading consistency metrics tell you whether your process is stable before your P&L does. Track these numbers to catch drift early.

Trading consistency metrics measure whether your process is stable before your P&L tells you something is wrong. Your equity curve shows results. Consistency metrics show whether the actions producing those results are repeating or drifting. When a trader follows the same plan, uses the same risk parameters, and enters setups the same way for 30 or 50 trades, the metrics stay flat. When they start improvising, the numbers move first. Tracking these five metrics gives you an early warning system that catches behavioral drift before it becomes a drawdown.
TL;DR
Your P&L is a lagging indicator. Consistency metrics catch process drift weeks before your equity curve reacts.
Five metrics matter most: plan adherence rate, risk consistency ratio, setup-type distribution, session timing variance, and average hold time.
A stable metric is not always a good metric. Stable at 40% plan adherence still means you break your rules 60% of the time.
Read these numbers weekly. Monthly is too late if you are drifting.
The fix for drift is not willpower. It is identifying exactly which metric moved and tracing it back to a specific behavior change.
Why P&L Hides Inconsistency
You can make money while doing everything wrong. That is the most dangerous thing about trading.
A trader breaks their rules, doubles their lot size on a hunch, enters outside their session window, and the trade works. The P&L says green. The equity curve ticks up. Every feedback signal says "keep doing this." But the process was broken the entire time. The next ten trades using that same broken process will eat the gain and then some.
This is the core problem: when traders win, they get overconfident and take trades outside their system. When they lose, they doubt the system and stop executing it. Both directions look the same on a consistency chart: the metrics move away from baseline.
P&L is a lagging indicator. It tells you what happened after the damage is done. Equity curves show results over time, but they cannot tell you whether this week's results came from disciplined execution or lucky improvisation. The curve goes up either way.
Consistency metrics are leading indicators. They flag when your behavior changes before the account balance reflects it. Think of it like a business tracking employee attendance before revenue drops. If attendance falls, revenue will follow. You just do not know the exact lag.
Five Metrics That Measure Process Consistency
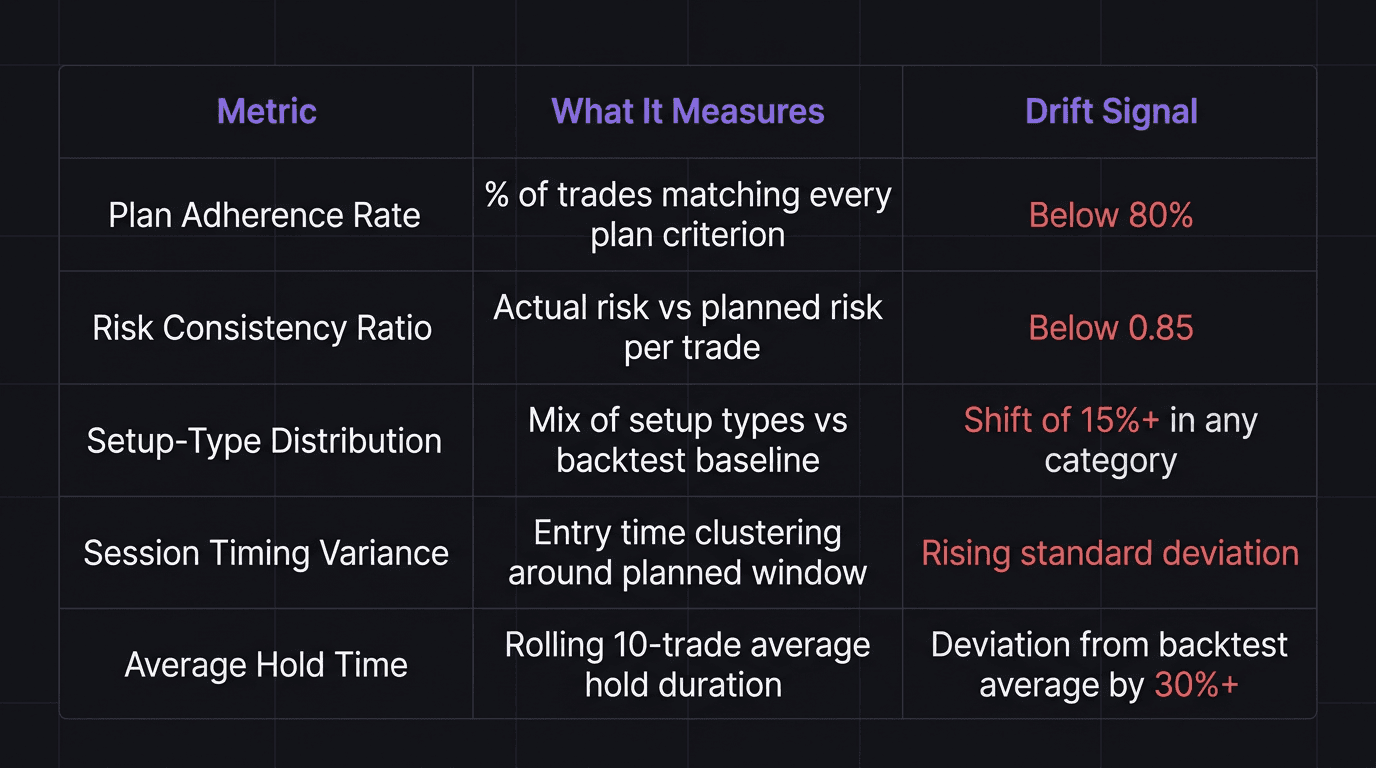
These five numbers, tracked across every trade, give you a clear picture of whether your process is stable or sliding.
1. Plan Adherence Rate
This is the percentage of trades you took that matched every criterion in your written plan. Entry trigger, session window, risk amount, pair, timeframe. All of it. If your plan says "only trade London session pullbacks on EUR/USD at 1% risk" and you took a New York breakout on GBP/JPY at 2% risk, that trade scores zero on adherence regardless of outcome.
Target: 80% or higher. Below that, you are improvising more than executing.
2. Risk Consistency Ratio
This measures how much your actual risk per trade varies from your planned risk. If your plan says 1% per trade and you risked 1% on 18 trades, 0.5% on 4 trades, and 2.5% on 3 trades, your risk consistency is low.
Calculate it as: (number of trades at planned risk) / (total trades). A ratio below 0.85 means your sizing is drifting.
3. Setup-Type Distribution
If your plan defines three valid setups (say, pullback to demand, break-and-retest, and liquidity sweep reversal), then your distribution should roughly match your backtest. If your backtest showed 60% pullbacks, 25% break-and-retest, and 15% sweeps, but your live trading shows 30% pullbacks and 45% break-and-retest, you are either forcing one pattern or avoiding another.
Track this weekly. Sudden distribution shifts often mean you started chasing a setup type that felt hot recently.
4. Session Timing Variance
When do you actually enter trades? If your plan says London open (07:00 to 10:00 UTC), your entries should cluster in that window. When entries start appearing at 14:00 or 22:00, you are trading outside your edge.
Measure it as the standard deviation of your entry times. A low standard deviation means tight clustering around your planned session. A rising standard deviation means drift.
5. Average Hold Time
Your strategy has an expected hold duration based on your backtest data. A swing trader holding positions for 2 to 5 days should see a stable average in that range. If your average hold time suddenly drops to 4 hours, you are cutting trades early. If it stretches to 12 days, you are holding losers too long.
Track the rolling 10-trade average. Big moves in hold time almost always correlate with emotional interference.
How to Read Consistency Data
Numbers without context are noise. A plan adherence rate of 72% does not mean anything until you compare it to your own baseline.
The first step is establishing your baseline. Take your first 30 to 50 trades under a documented plan and calculate all five metrics. That set of numbers is your "normal." Every week after that, you compare the current rolling numbers to that baseline.
What matters is not the absolute value but the direction and speed of change. A plan adherence rate dropping from 88% to 82% over four weeks is a slow drift. Dropping from 88% to 65% in one week is an alarm. Both need attention, but the second one means something specific happened. Maybe a losing streak triggered emotional trading. Maybe you switched to a new pair without updating your plan.
Read these numbers as a set, not individually. If plan adherence drops and risk consistency drops at the same time, you are probably revenge trading or chasing losses. If session timing drifts but everything else holds, you might just be bored and looking for trades outside your window.
Your monthly stats should include all five consistency metrics alongside the usual P&L and win rate numbers. The combination tells you whether your results came from process or luck.
Walkthrough: Spotting Drift in a Dashboard
The Setup
A swing trader, let's call them Trader A, runs a system on EUR/USD and GBP/USD during London session. The plan says: trade pullbacks to H4 demand zones during the 07:00 to 10:00 UTC window, risk 1% per trade, target 2R minimum. The backtest over 200 trades showed 55% pullback entries, 30% break-and-retest, 15% liquidity sweep entries.
Week 1 to 4: Baseline
Trader A's first month of live execution looks clean. Plan adherence: 84%. Risk consistency: 0.92. Setup distribution: 58% pullback, 28% break-and-retest, 14% sweep. Session timing standard deviation: 38 minutes (tight clustering around 08:00 to 09:30 UTC). Average hold time: 3.2 days. P&L: +4.8%.
All five metrics are stable. The process matches the plan.
Week 5 to 6: The Drift
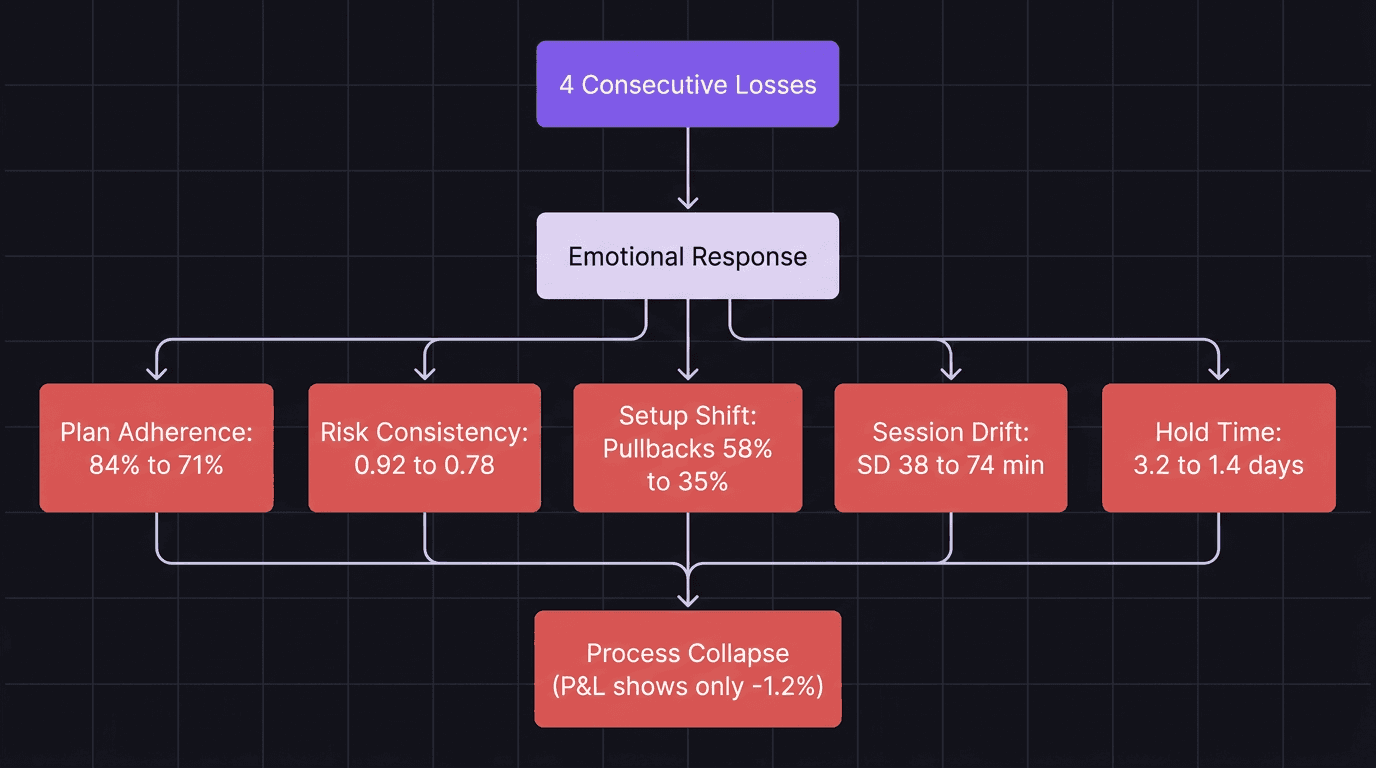
Trader A hits a losing streak. Four consecutive losses. Still within the plan, still valid setups, but the results hurt. Here is what the metrics show:
Plan adherence drops from 84% to 71%. Two trades were taken outside the plan criteria. Risk consistency drops from 0.92 to 0.78. After the third loss, Trader A cut risk to 0.5% on two trades (fear), then bumped to 2% on the next trade (trying to recover). Setup distribution shifts: pullbacks drop to 35%, break-and-retest jumps to 50%. Trader A started chasing breakout entries because pullbacks "were not working." Session timing standard deviation doubles from 38 to 74 minutes. Two entries happened at 13:00 UTC, well outside the London window. Average hold time drops from 3.2 days to 1.4 days. Cutting winners short.
The P&L for weeks 5 to 6: minus 1.2%. Not catastrophic. A trader looking only at the P&L might say "rough couple weeks, but manageable." But the consistency metrics tell a completely different story. Every single metric moved. The process is breaking down.
What the P&L Missed
If Trader A only tracked P&L and win rate on the dashboard, they would see a dip and shrug it off. Normal variance. But the consistency data shows that the dip came from five separate behavioral changes happening simultaneously. That is not variance. That is process collapse.
The metrics caught it two weeks before the equity curve would have shown a real problem. That is the value.
What to Do When Metrics Flag a Problem
The instinct when metrics drift is to try harder. Grit your teeth, promise to follow the plan tomorrow, and move on. That does not work. The reality is blunt: emotions are the root cause, and you cannot willpower your way out of them. You need a mechanical response.
Step 1: Identify Which Metric Moved First
Drift rarely hits all five metrics at once on day one. Usually one goes first and the others follow. If risk consistency dropped before anything else, the problem started with position sizing. Maybe you got scared after a loss and cut size, or got greedy after a win and increased it. If session timing moved first, you started looking for trades outside your window, which means boredom or FOMO.
The first metric to move points to the root behavior.
Step 2: Trace It to a Specific Event
Check your journal. What happened the day before or the day of the first shift? A big loss? A news event you reacted to? A winning streak that made you feel invincible? The cycle is predictable: wins lead to overconfidence, losses lead to fear, both lead to abandoning the system.
Your trading performance review should cross-reference consistency metric changes with specific trades and dates.
Step 3: Reduce, Do Not Expand
When metrics drift, the fix is almost always to shrink your activity, not increase it. Drop to minimum lot size. Trade only your highest-conviction setup type. Stick to one pair. Execute 10 trades at reduced size with the sole goal of bringing all five metrics back to baseline.
This is the same principle behind consistent actions and consistent results. The inputs have to stabilize before the outputs can.
Step 4: Re-Baseline After the Fix
Once you execute 10 to 15 trades at baseline metrics, recalculate your rolling averages. If all five are back within your original ranges, resume normal sizing. If one or two are still off, keep the reduced approach until they stabilize.
Do not rush this. Restoring consistency matters more than recovering the P&L.
How EdgeFlo Tracks Consistency for You
EdgeFlo's dashboard includes a discipline summary that measures execution quality across your trades. Instead of building spreadsheets to calculate plan adherence and risk ratios manually, the dashboard surfaces these numbers automatically from your journal data.
The EdgeScore measures execution quality as a single composite number. It factors in whether you followed your plan, managed risk according to your rules, and stuck to your documented process. When your EdgeScore trends down, you know your consistency is slipping before the equity curve reacts.
For Plus users, the weekly AI report flags inconsistencies it detects in your trading patterns. If your session timing drifts or your setup distribution shifts suddenly, the report calls it out with specific trades and dates. That turns a vague feeling of "something is off" into a concrete, actionable diagnosis. The report is generated by AI, so it adapts to your specific patterns rather than applying generic thresholds. You still own the decision about what to change. The report surfaces the data. Combined with expectancy tracking, these tools give you the full picture: process stability and edge quality in one place.
The Edge Brief
Receive Insights on trading psychology, discipline, and the behavioral patterns that create consistent traders from our Founder and the EdgeFlo team, delivered to your inbox.
Think different. Trade different.
What are trading consistency metrics?
How many trades do I need before consistency metrics are reliable?
Can I be consistent and still lose money?
What is the most important consistency metric for beginners?

Turn discipline on.
Every session.
EdgeFlo is the environment serious traders operate inside.
Start 7-Day Trial — $7
Cancel anytime.
No long-term commitment.


Think Different, Trade Different.