

5 Trade Plan Variables You Should Be Testing Right Now
Your trade plan has five testable variables: entry type, stop width, take-profit method, session, and confirmation trigger. Learn how to isolate and test each one.

Your trade plan is not one big thing. It is a collection of small decisions stacked together: where you enter, where your stop goes, how you take profit, which session you trade, and what confirms your setup. Each of these is a variable. Each one can be tested independently. And most traders never test any of them. They guess, commit, and wonder why the results feel random.
TL;DR
Every trade plan has five key variables: entry type, stop-loss width, take-profit method, session filter, and confirmation trigger.
Change only one variable at a time and keep everything else locked.
Run at least 100 trades per variable setting to get meaningful data.
Track win rate, average R, and expectancy for each setting.
Keep what makes money. Kill what does not. Your plan improves through elimination.
Why Your Trade Plan Has Variables
A mechanical trading plan is built from rules. But those rules contain choices that could go either way. Should your stop loss be 5 pips below the zone or 15 pips? Should you enter at the edge of the zone or wait for a break of structure confirmation? Should you trade London session only, or include New York?
These are not right-or-wrong questions. They are variable questions. The answer depends on your specific strategy, the pairs you trade, and the market conditions you target. The only way to find the right answer is to test each option against real data.
Here is the problem most traders face: they pick their variables based on what feels right or what they saw in a YouTube video. Then they stick with those settings forever, never testing alternatives. Or worse, they change everything at once after a losing week, making it impossible to know which change helped or hurt.
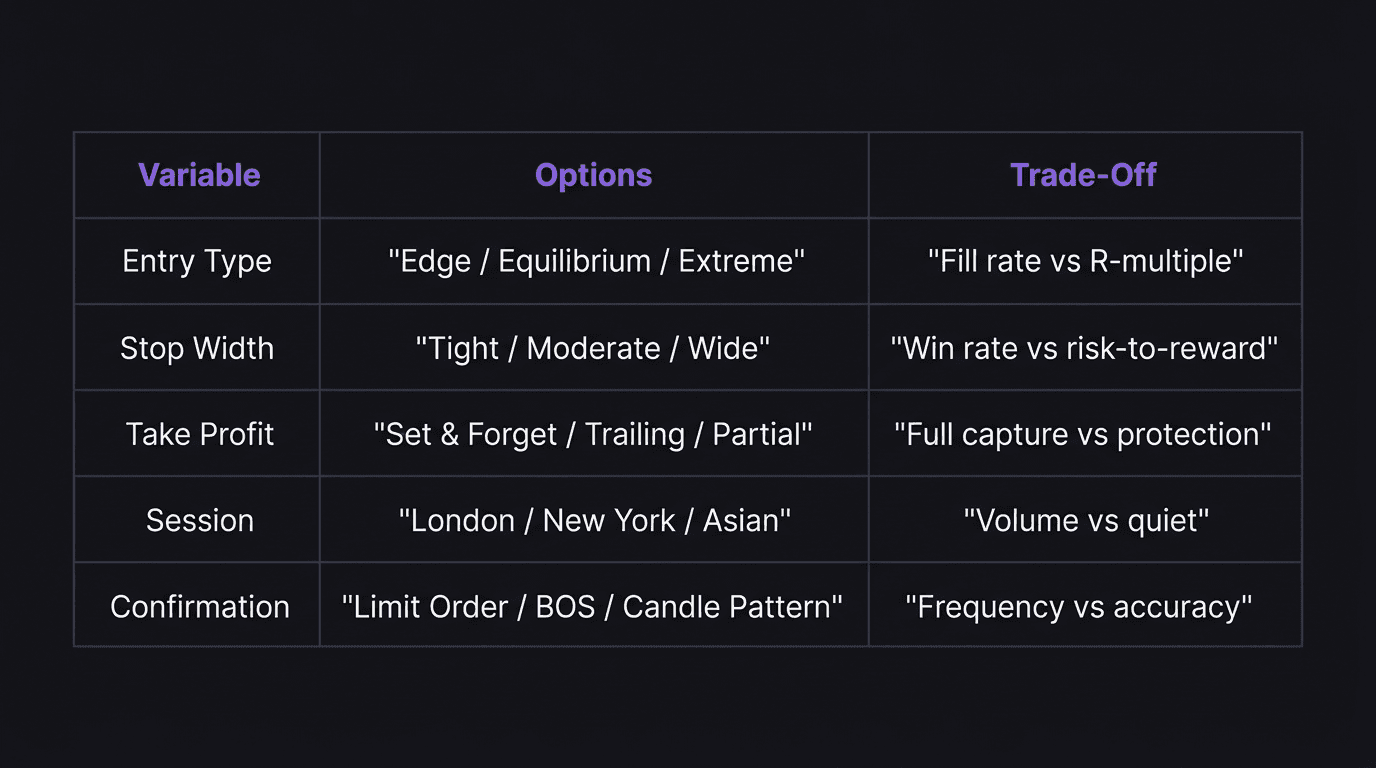
The Five Variables Worth Testing
1. Entry Type
Where exactly do you enter at a zone? You have three options:
Edge: Enter at the first touch of the zone. Tightest stop, most frequent fills, but also the most frequent stop-outs.
Equilibrium (50%): Enter at the midpoint of the zone. Moderate stop, moderate fill rate. A balanced option.
Extreme: Enter at the deepest point of the zone. Widest stop, fewest fills, but the best risk-to-reward when it triggers.
Each option produces a different win rate and a different average R. You cannot know which one is better for your strategy without testing all three over at least 100 trades each.
2. Stop-Loss Width
A 2-pip stop on a demand zone will get clipped by spread and slippage constantly. A 30-pip stop might keep you in trades but destroy your risk-to-reward ratio. Somewhere in between is the width that gives your setup room to breathe without overexposing your account.
Test a tight stop (structure-based, just below the zone), a moderate stop (a few pips below the zone extreme), and a wide stop (below the nearest liquidity level). Track which width produces the highest expectancy, not just the highest win rate.
3. Take-Profit Method
How you exit a winning trade changes your entire performance profile. The three most common methods:
Set and forget: Place your target at a fixed level (opposing zone, swing high/low) and walk away.
Trailing stop: Move your stop to break even after the first structural shift, then trail it behind each new swing point.
Partial profits: Take half off at 1:1 or 1:2, trail the rest.
Set and forget captures full moves but gives back profit on reversals. Trailing stops protect profit but cut winners short. Partial profits reduce variance but lower the average R on winning trades. There is no universal best. There is only what works best for your strategy and your psychology.
4. Session Filter
Not every hour of the market behaves the same. London session is high-volume and often trends cleanly. New York overlap is volatile. Asian session is quiet and ranges.
Your strategy might perform well during London and terribly during Asian session. Or your setups might trigger mostly during New York. The only way to know is to tag every trade with the session you took it in, run 100 trades, and compare the results by session.
If one session consistently underperforms, remove it from your plan. You just improved your expectancy without changing your strategy.
5. Confirmation Trigger
Some traders enter on a limit order (price touches the zone, order fills automatically). Others wait for a lower-timeframe break of structure to confirm the zone is holding. Others require a specific candle pattern (engulfing, pin bar) at the zone.
More confirmation means fewer entries but (usually) a higher win rate. Less confirmation means more entries but more stop-outs. The question is whether the additional confirmation produces enough extra wins to justify the missed setups.
How to Isolate and Test One Variable at a Time
This is where most traders go wrong. They change their entry type, their stop width, AND their take-profit method after a bad week. Then the next week goes well. They have no idea which change helped. So they lock in all three changes, and when the bad results return, they are back to guessing.
The rule is simple: change one variable, lock everything else.
Here is how to run a clean test:
Step 1: Pick the variable you want to test. Start with entry type, since it has the most direct impact on both win rate and R-multiple.
Step 2: Define the two or three options you want to compare. For entry type, that is edge, equilibrium, and extreme.
Step 3: Run 100 trades using only one option. Log every trade with the same stop method, same take-profit method, same session filter, same confirmation trigger. The only thing that changes is the entry type.
Step 4: After 100 trades, calculate your win rate, average R, and expectancy for that setting.
Step 5: Reset and run 100 trades with the next option. Same everything else. Only the entry type changes.
Step 6: Compare results. Keep the winner. Move on to the next variable.
Walkthrough: Testing Entry Type on AUD/USD
You trade AUD/USD demand zones on the 1-hour chart. Your current setup uses edge entries, a 10-pip stop, set-and-forget exits targeting the opposing supply zone, London session only, and a lower-timeframe break of structure for confirmation.
Over 100 trades with edge entries, your results are: 38 wins, 62 losses. Average winner is 2.8R. Average loser is 1R.
Win rate: 38 / 100 = 38%. Expectancy: (0.38 x 2.8R) + (0.62 x -1R) = 1.064R + (-0.62R) = 0.444R per trade.
Math check: 38 wins out of 100 trades = 38% win rate. Correct. 0.38 times 2.8R = 1.064R. Correct. 0.62 times 1R = 0.62R. Correct. 1.064R minus 0.62R = 0.444R. Correct.
Now you run 100 trades with equilibrium entries, everything else identical. Results: 32 wins, 68 losses. Average winner is 3.6R. Average loser is 1R.
Win rate: 32 / 100 = 32%. Expectancy: (0.32 x 3.6R) + (0.68 x -1R) = 1.152R + (-0.68R) = 0.472R per trade.
Math check: 32 wins out of 100 trades = 32% win rate. Correct. 0.32 times 3.6R = 1.152R. Correct. 0.68 times 1R = 0.68R. Correct. 1.152R minus 0.68R = 0.472R. Correct.
The equilibrium entry has a lower win rate but a higher expectancy (0.472R vs 0.444R). You switch to equilibrium entries and move on to testing the next variable.
That is the process. Slow, boring, and the only thing that actually works.
Reading the Data: What the Results Tell You
After 100 trades on a variable setting, you have three numbers that matter:
Win rate tells you how often the setting produces a winner. But win rate alone is misleading. A 70% win rate means nothing if your average winner is 0.5R and your average loser is 1R.
Average R-multiple tells you how big your winners are relative to your losers. A 2R average winner means you make twice your risk on winning trades.
Expectancy combines both. It tells you how much you expect to make per trade, on average, over a large sample. Positive expectancy means your edge is real. Negative expectancy means you are bleeding, no matter how good the setup looks.
The formula: expectancy = (win rate x average win) minus (loss rate x average loss).
If one variable setting has a higher expectancy than another, that is your answer. Keep the higher one. The feelings do not matter. The comfort does not matter. Only the data matters.
When to Retest
Markets change. A variable setting that worked in trending conditions might underperform in ranging conditions. Retest your variables every quarter (or every 200 trades, whichever comes first). If the data still supports your current settings, keep them. If not, test alternatives.
This is how you refine a plan without blowing it up. Small adjustments, driven by data, tested properly. Not emotional overhauls after a bad week.
How EdgeFlo Tracks Variable Performance Across Trades
Testing variables by hand is tedious. You are tagging entries, calculating averages, and comparing spreadsheets. It works, but it is slow.
EdgeFlo's journal lets you tag each trade with specific variables, such as entry type, session, or stop-loss method. Over time, EdgeFlo surfaces performance differences across those tags. You can filter your dashboard to see: "How did my equilibrium entries perform versus my edge entries over the last 50 trades?"
That kind of filtered analysis used to require a custom spreadsheet. Inside EdgeFlo, it is built into the journal workflow. You trade, tag, and review. The data accumulates automatically.
The goal is the same whether you use EdgeFlo or a notebook: test one thing at a time, collect 100 trades, and let the numbers decide. The tool just makes the collection and comparison faster.
Backtesting can speed up the initial variable selection, but forward testing in live conditions is where you confirm the results hold. Both are part of the process.
What are trade plan variables?
How many trades do I need to test a variable?
Should I test all five variables at once?
What if a variable test shows worse results?

Turn discipline on.
Every session.
EdgeFlo is the environment serious traders operate inside.
Start 7-Day Trial — $7
Cancel anytime.
No long-term commitment.


Think Different, Trade Different.