

Trade Journal Analysis: Find What Actually Works
Trade journal analysis turns raw entries into patterns. Learn how to extract what works, cut what doesn't, and improve every week.

Trade journal analysis is the process of reviewing tagged journal entries to find which setups, sessions, and behaviors produce your actual edge. Most traders write down their trades but never extract the patterns hiding in those entries. The analysis step is where journaling pays off: you compare setups against outcomes, measure your real expectancy, and isolate the specific conditions where you make (or lose) money. Without it, your journal is just a diary.
TL;DR
Journaling without analysis is just note-taking. The review step is where you find your edge.
Tag every trade with setup type, session, and emotional state so you can filter and compare.
Track win rate, average R, and profit factor per setup to see what actually works.
A 30-day analysis pass reveals which setups to keep, which to cut, and which need more data.
Weekly micro-reviews prevent small leaks from becoming account-draining habits.
Why Most Traders Journal but Never Analyze
You probably already know you should journal. Maybe you even do it. You write down the pair, the direction, the result. Good. But here is the problem: writing entries is not the same as reading them.
The principle is simple. There is a feedback loop where you record trades, learn from mistakes, and then improve your inputs. That loop only works if you actually close it. Most traders leave it open. They journal for a week, feel productive, then never look back at what they wrote.
Sound familiar?
The reason is simple. Journaling feels like work you already did. Sitting down on a Friday to re-read 15 entries from the week feels redundant. You lived those trades. Why relive them?
Because your memory lies to you. You remember the big winner from Tuesday but forget the three mediocre entries that preceded it. You remember feeling confident on Thursday but forget that your "confidence" was actually revenge energy from Wednesday's stop-out. The journal holds the truth. Your memory holds the highlight reel.
The traders who actually improve are the ones who treat journal entries as raw data and schedule time to process that data into decisions. That is what trade journal analysis is: turning scattered notes into a clear picture of your real performance.
How to Extract Patterns from Your Journal
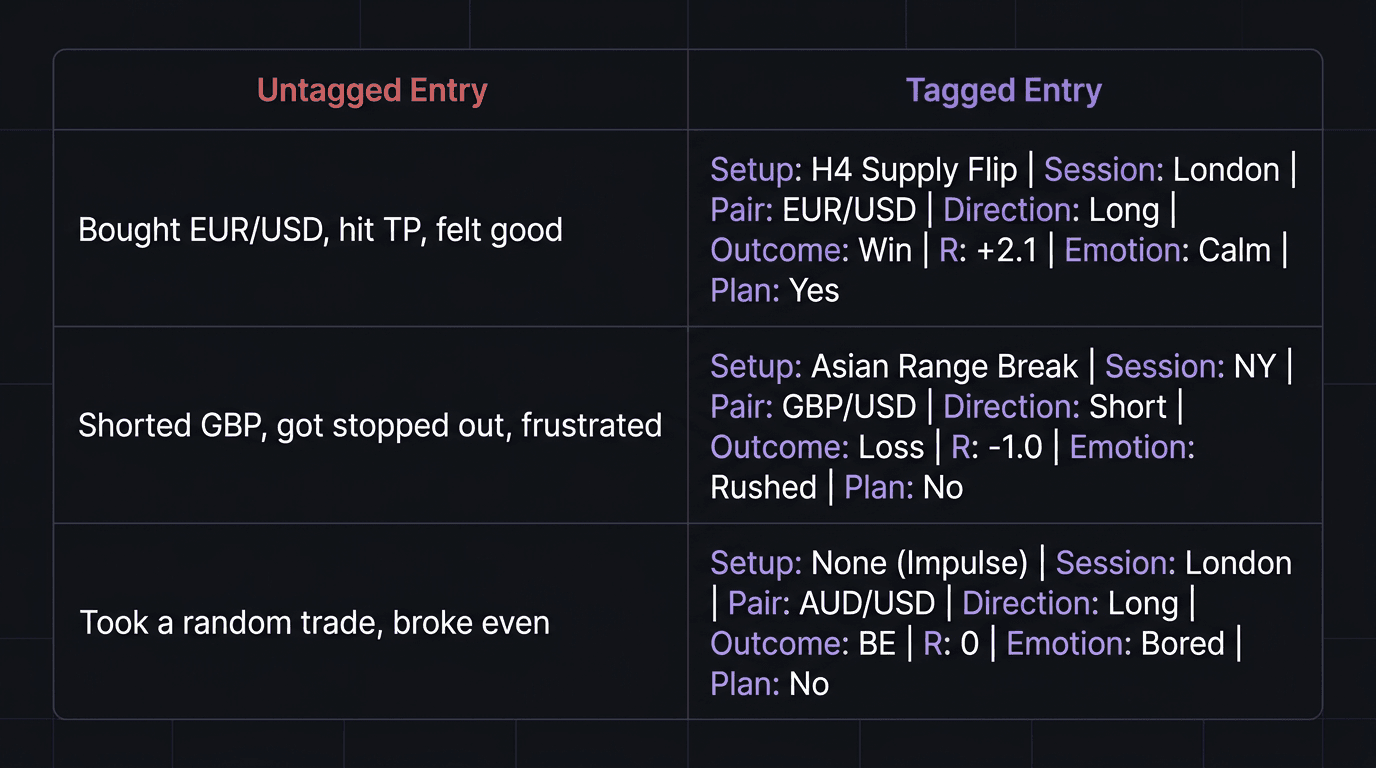
Pattern extraction starts with tagging. If your journal entries are just paragraphs of text, you cannot filter or compare them. You need structure.
Every entry needs at minimum:
Setup type (your name for it: "London breakout," "H4 supply flip," "Asian range break")
Session (London, New York, Asian overlap)
Pair
Direction (long or short)
Outcome (win, loss, breakeven)
R result (how many R you gained or lost)
Emotional state (calm, rushed, anxious, revenge, bored)
Plan compliance (did you follow your rules, yes or no)
With those tags in place, you can start asking real questions. Not "how did I do this week?" but specific questions like:
What is my win rate on London breakout setups vs Asian range breaks?
Do I perform better going long or short on GBP/USD?
What happens to my R when I tag my emotional state as "rushed"?
How does my plan compliance rate change on Fridays vs Mondays?
These are the questions that reveal your edge. And they only become answerable when your journal entries follow a consistent template.
Metrics That Reveal Your Real Edge
Numbers do not lie, but the wrong numbers mislead. Tracking only your PnL in dollars tells you almost nothing useful about process quality. Here are the metrics that actually matter when you analyze your journal.
Win Rate (Per Setup)
Your overall win rate is a blended average that hides the truth. If you take three different setup types and one wins 65% of the time while another wins 30%, the blend might show you at 45%. That looks mediocre, but it masks a strong edge buried inside one setup.
Break your win rate down by setup type. Then break it down by session. Then by pair. Each filter peels back a layer.
Average R (Per Setup)
Win rate means nothing without knowing how big your wins are relative to your losses. A 35% win rate with an average winner of 3.2R and an average loser of 1R is a profitable strategy. A 60% win rate with 0.5R winners and 1R losers is a slow bleed.
Average R per setup tells you which setups deliver disproportionate reward.
Profit Factor
Profit factor is total gross profit divided by total gross loss. Above 1.0 means you are net profitable. Above 1.5 is solid. Above 2.0 is excellent.
The power of profit factor is that it combines win rate and R into a single number. If your London breakout setup has a profit factor of 2.3 but your Asian range setup sits at 0.7, you have a clear signal: do more of one, stop doing the other.
Your trading expectancy calculation formalizes this into a per-trade expected value. Together with profit factor, these two metrics tell you whether your edge is real or lucky.
Plan Compliance Rate
This one is underrated. If you tag every trade with a simple yes/no for "did I follow my plan," you can split your results into two buckets: on-plan trades and off-plan trades. Almost every intermediate trader discovers that their on-plan trades are profitable and their off-plan trades are not.
That single insight is worth more than any indicator.
Walkthrough: Analyzing 30 Days of Entries
Here is a concrete example of what trade journal analysis looks like in practice.
The Setup
A swing trader (we will call them Trader M) journals every trade in a spreadsheet. They trade two setups: a "demand zone bounce" and an "H4 trend continuation." They trade GBP/USD and EUR/USD during London session. They have been trading live for four months and want to know what is actually working.
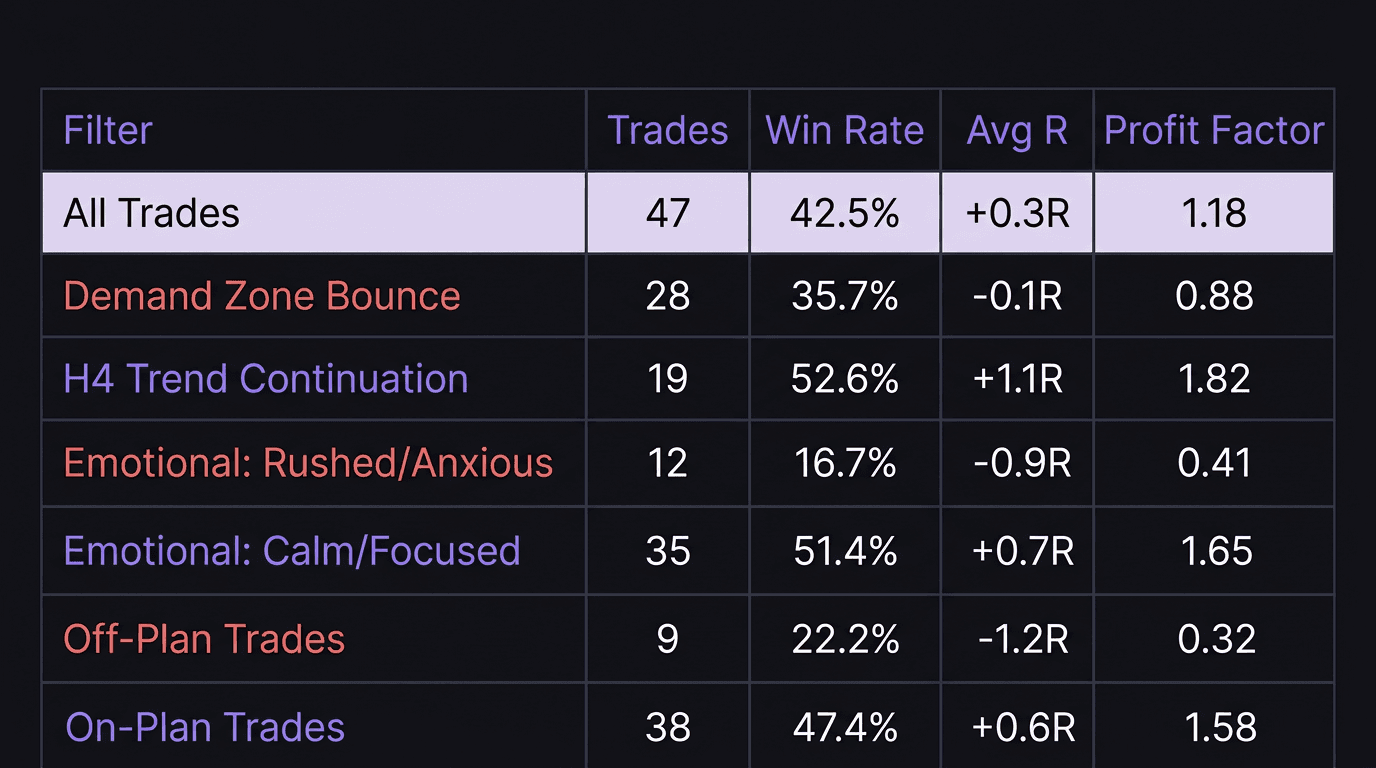
Trader M sits down on a Sunday with 47 trades from the past 30 days. Here is what the raw numbers look like:
Total trades: 47
Overall win rate: 42.5% (20 wins, 27 losses)
Overall average R: +0.3R
Overall profit factor: 1.18
At first glance, that looks barely profitable. Trader M might think their strategy needs an overhaul. But then they filter.
Filtering by Setup Type
Win rate: 35.7% (10 wins, 18 losses)
Average R: -0.1R
Profit factor: 0.88
Win rate: 52.6% (10 wins, 9 losses)
Average R: +1.1R
Profit factor: 1.82
The blended numbers hid a clear story. The demand zone bounce setup is losing money. The H4 trend continuation is carrying the entire account.
Filtering by Emotional State
Trader M tagged 12 of the 47 trades as "rushed" or "anxious." Those 12 trades had a win rate of 16.7% and an average R of -0.9R. The remaining 35 trades (tagged "calm" or "focused") had a win rate of 51.4% and an average R of +0.7R.
Filtering by Plan Compliance
Of the 47 trades, 38 were on-plan and 9 were off-plan. On-plan trades: 47.4% win rate, +0.6R average. Off-plan trades: 22.2% win rate, -1.2R average.
The Decision
Trader M now has three clear actions:
Cut the demand zone bounce setup (or pause it and re-test on a demo account with tighter entry criteria).
Take fewer trades when emotionally compromised. The "rushed" tag was a consistent predictor of losses.
Stop taking off-plan trades. Nine off-plan trades cost roughly 10.8R over the month. That is real money.
None of this was visible from the blended numbers. The analysis pass took about 45 minutes. The insight saved Trader M from abandoning a strategy that actually works, which is exactly the cycle that kills accounts: doubting your strategy after losses, when the real problem is execution quality, not the system itself.
This is why the core principle holds: do "more of what works and less of what doesn't." Simple advice. But impossible to follow without analysis telling you which is which.
Turning Analysis into Action
Patterns are useless if they stay in a spreadsheet. The final step is converting what you found into rule changes, setup filters, or process adjustments.
The Weekly Micro-Review
Every weekend, spend 15 to 20 minutes scanning the past week. Not a full deep dive. Just three questions:
Which trades were off-plan? Flag them. Count them. If the number is rising, that is your top priority fix.
Which emotional tags showed up most? If "bored" appeared four times and three of those trades lost, you have a boredom-trading problem.
Did any setup underperform? If one setup went 0-for-4 this week, note it. One bad week is not a signal to quit. Three bad weeks in a row is a signal to investigate.
The weekly micro-review feeds directly into your trading review process. It is the lightweight version that keeps you honest between monthly deep dives.
The Monthly Deep Dive
Once a month, do the full Trader M exercise. Pull all trades. Filter by every tag. Calculate the metrics. Compare this month to last month. Look at your equity curve for slope changes.
The monthly review answers the bigger questions: Is my edge growing or shrinking? Am I trading more or less than last month? Is my plan compliance improving?
Converting Insights into Rules
Every analysis pass should produce at most two action items. Not ten. Two. If you find that your Friday trades have a 25% win rate, your action item might be: "No trades on Fridays for the next two weeks. Re-evaluate after."
If you find that your boredom trades lose 80% of the time, your action item might be: "Add a pre-trade tag. If I mark 'bored,' I skip the trade."
Small, specific rule changes. Not overhauls. Think of it as a lifelong feedback loop: input, process, output, feedback, then improved input. Each analysis cycle tightens one small thing.
What Not to Do After Analysis
Do not change your entire strategy based on 30 trades. Do not add five new rules at once. Do not abandon a setup after one bad month if it has two good months behind it.
The most common mistake after analysis is overreaction. You see a pattern, feel urgency, and rebuild everything. That is the same emotional cycle that drains accounts: losing leads to doubt, doubt leads to system-hopping, and system-hopping leads to more losses.
Make one change. Trade it for two weeks. Then do your post-trade review again. Let the data confirm whether the change helped.
How EdgeFlo Makes Journal Analysis Automatic
EdgeFlo's AI journal tags emotions automatically from your trade notes, so you do not have to remember to categorize your mental state after every trade. The tags are consistent and honest, which removes the self-reporting bias that makes manual emotion tracking unreliable.
The dashboard shows win rate, profit factor, and average R broken down by the filters that matter. Instead of building a spreadsheet from scratch every month, you open one screen and see the splits already calculated. That means you can run the Trader M exercise in five minutes instead of forty-five.
For Plus users, the weekly AI report surfaces patterns you might miss on your own. It reads across your tagged entries and highlights emerging trends (like a dropping win rate on a specific setup or a spike in off-plan trades). Think of it as a second pair of eyes on your journal, one that never gets bored of reading entries.
The Edge Brief
Receive Insights on trading psychology, discipline, and the behavioral patterns that create consistent traders from our Founder and the EdgeFlo team, delivered to your inbox.
Think different. Trade different.
How often should I analyze my trading journal?
What metrics matter most in journal analysis?
Can I analyze my journal without special software?
How many trades do I need before analysis is useful?

Turn discipline on.
Every session.
EdgeFlo is the environment serious traders operate inside.
Start 7-Day Trial — $7
Cancel anytime.
No long-term commitment.


Think Different, Trade Different.