

Swing Structure Trading: Map Highs and Lows
Learn how to map swing highs and swing lows mechanically, identify strong vs weak levels, and know exactly when a swing level is invalidated.

Swing structure trading is how you read the trend at its highest level. Swing highs and swing lows are the major turning points on your chart, and they tell you one thing clearly: is price making higher highs and higher lows, or lower highs and lower lows? That answer defines your directional bias. If you cannot identify swing structure correctly, every other piece of analysis sits on a broken foundation. The process is mechanical. No guessing, no "it looks like" reasoning. You either have a higher high confirmed by a body close, or you do not.
TL;DR
Swing structure tracks the largest highs and lows that define the trend direction.
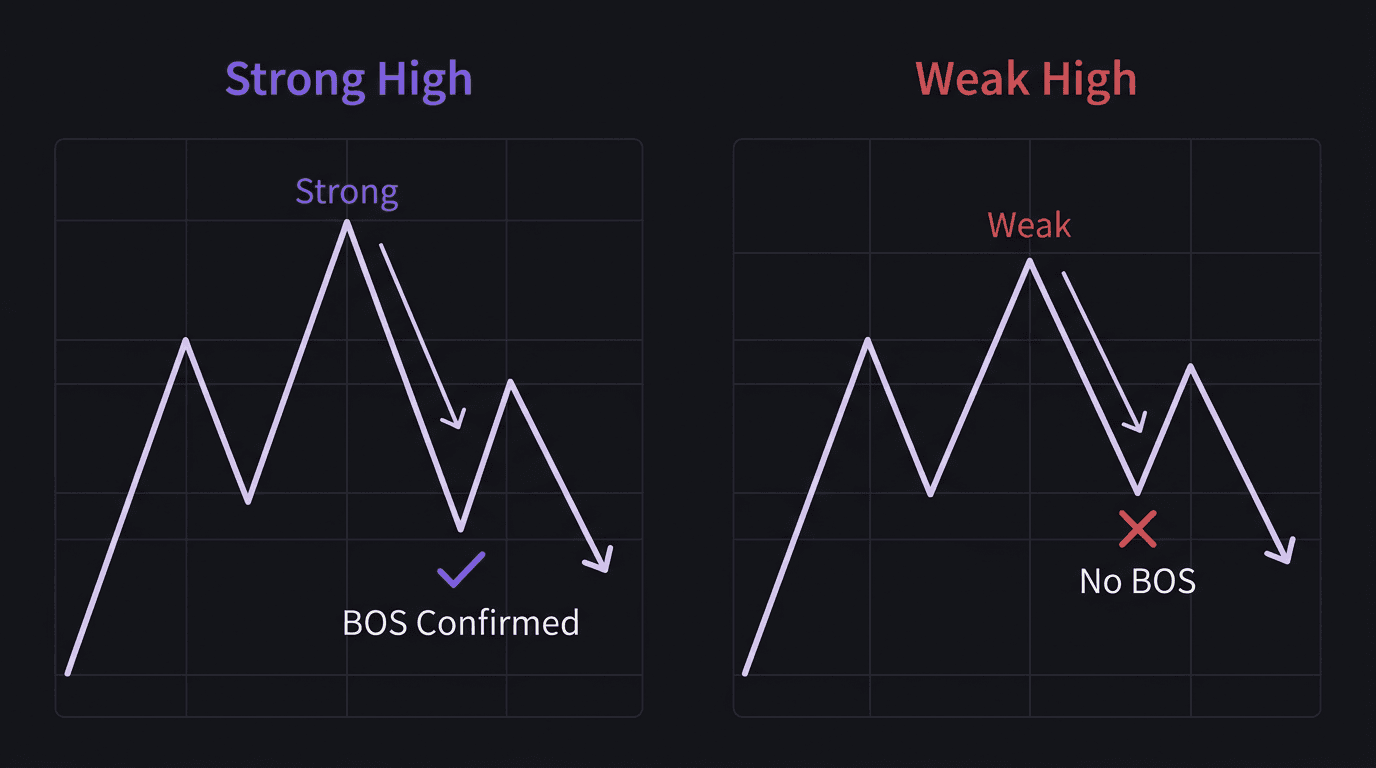
Strong highs/lows are created by moves that broke structure. Weak ones are not.
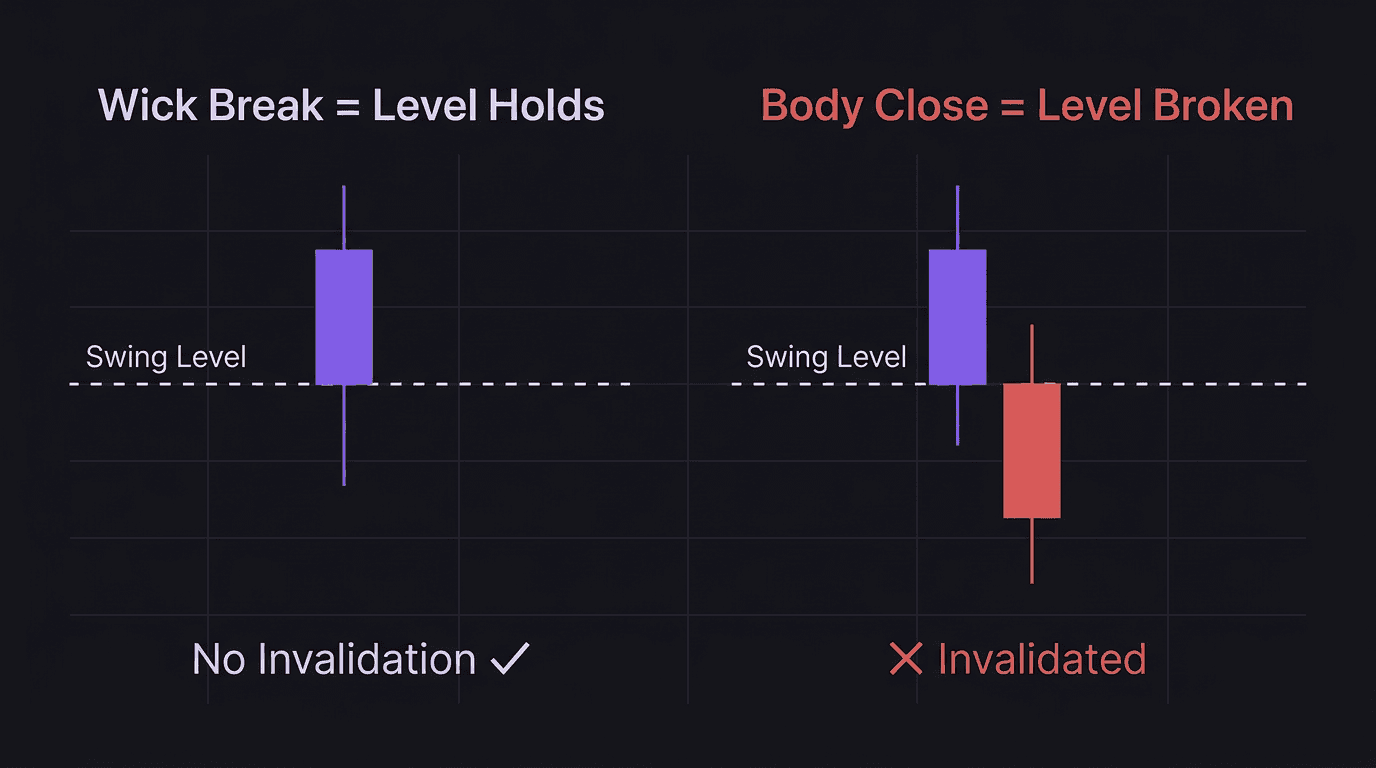
A swing level is only broken when a candle body closes past it, not on a wick.
Misidentifying swing points leads to trading against the actual trend.
Map swing levels before every session to establish your daily bias.
What Is Swing Structure
Swing structure is the skeleton of a trend. It connects the major highs and major lows, ignoring the smaller moves that happen between them.
In an uptrend, you see higher highs (HH) and higher lows (HL). Each push up exceeds the previous peak, and each pullback holds above the previous trough. In a downtrend, you see lower highs (LH) and lower lows (LL). Each push down exceeds the previous trough, and each rally fails below the previous peak.
The difference between swing structure and internal structure is scale. Internal structure tracks the smaller moves that happen within a single swing leg. Swing structure only cares about the big turning points. Think of it as the difference between tracking the overall market direction versus tracking the wiggles inside each move.
Here is why this matters for your actual trading: if swing structure is bullish (HH/HL), you should be looking for longs. If swing structure is bearish (LH/LL), you should be looking for shorts. Going against swing structure is fighting the trend, and the trend wins most of the time.
One more thing. Swing structure exists on every timeframe. The 4H has its own swing points. The 1H has its own. The 15M has its own. You pick the timeframe that matches your trading style, then map the swing points on that chart. Do not mix timeframes when mapping a single swing structure.
Strong Highs vs Weak Highs
Not every swing high carries the same weight. Some highs are "strong" and some are "weak." The distinction matters because it tells you how likely a level is to hold.
A strong high is created by a move that broke structure on the opposite side. Here is what that means in practice: if price pushed down from a swing high and broke the previous swing low (creating a break of structure), then the high that started that move is a strong high. The move that followed it proved its strength by achieving a structural break.
A weak high is created by a move that failed to break the opposite swing level. Price pulled back from the high but did not break the previous low. No structural break occurred. The high lacks confirmation.
The same logic applies to lows. A strong low is one whose subsequent rally broke the previous swing high. A weak low is one whose subsequent rally failed to reach or break the high.
Why does this matter? Strong highs and strong lows are protected. They tend to hold when retested. The market has already shown that the move from that level was powerful enough to shift structure. Weak levels, on the other hand, are more likely to get taken out.
Example: AUD/USD 4H chart, bullish swing structure.
Price makes a swing low at 0.6520, rallies to a swing high at 0.6610, then pulls back to 0.6555 (a higher low). The rally from 0.6555 breaks above 0.6610, creating a new higher high at 0.6640.
The swing low at 0.6555 is now a strong low because the move from 0.6555 broke the previous high at 0.6610. If price later pulls back toward 0.6555, that level is more likely to hold.
Now imagine the rally from 0.6555 only reached 0.6600 and failed to break 0.6610. The low at 0.6555 would be a weak low because its rally did not achieve a structural break. If price comes back to 0.6555, it is more vulnerable.
When you are mapping your chart, label your swing points as strong or weak. It takes 30 seconds and dramatically improves your supply and demand zone analysis. Strong levels deserve more respect. Weak levels deserve more caution.
Mapping Swing Levels Correctly
The biggest mistake traders make with swing structure is marking too many levels. If every minor peak is a "swing high," you end up with a chart full of lines and zero clarity.
Here is the mechanical process:
Step 1: Zoom out. Start by looking at the last 50 to 100 candles on your timeframe. You want to see the big picture before you start marking.
Step 2: Identify the obvious turning points. Swing highs are peaks with clearly lower candles on both sides. Swing lows are troughs with clearly higher candles on both sides. If you have to squint or debate whether something is a swing point, it probably is not one.
Step 3: Connect the dots. Draw lines between your swing highs and between your swing lows. This creates the zigzag pattern that shows you the trend. HH-HL-HH-HL is bullish. LH-LL-LH-LL is bearish.
Step 4: Label strong and weak. Go through each swing point and check whether the move from that point broke structure on the other side.
Step 5: Remove the noise. If two swing highs are very close together and no meaningful move happened between them, keep the more significant one and remove the other. Swing structure should be clean.
Common mistake: USD/CAD 1H chart.
A trader marks every tiny peak as a swing high. They end up with 15 "swing highs" in a 3-day period. When price breaks one of them, they think structure has shifted. But it was just a minor bump, not a real swing point. They flip their bias from bearish to bullish based on a meaningless break, then price continues lower.
The fix: only mark the turning points that started significant moves. If the move from the high (or low) only lasted 3 to 5 candles before reversing, it is probably internal structure, not swing structure.
Once your swing levels are mapped, you can backtest your strategy against those levels. Check how often price respected strong levels versus weak ones. The data will reinforce why the strong/weak distinction matters.
What Invalidates a Swing Level
A swing level is invalidated when price closes its body past it. Not a wick. A body close.
This is one of the most important rules in swing structure trading, and it is completely mechanical. You do not need to interpret anything. Open your chart, look at the candle, check if the body (the solid part, not the shadow) closed past the swing level. If yes, the level is broken. If no, it holds.
Why body close and not wick? Because wicks often represent liquidity sweeps. Price spikes past a level, triggers the stop losses sitting there, then reverses. If you treated every wick as a break, you would flip your bias constantly and get chopped up.
Here is how invalidation works at each stage:
Swing high invalidated (in a downtrend): Price has been making LH/LL. A candle body closes above the most recent swing high (lower high). The downtrend structure is now broken. You either have a potential reversal or a range forming.
Swing low invalidated (in an uptrend): Price has been making HH/HL. A candle body closes below the most recent swing low (higher low). The uptrend structure is now broken.
What happens after invalidation? One break does not immediately mean the opposite trend is in play. After a swing break, you often enter a ranging phase where price chops between the broken level and the next significant swing point. Wait for new swing structure to form before committing to the new direction.
The body close rule applies to internal and swing structure. Fractal structure is different: fractal breaks only need a wick. That distinction is why fractal breaks are more frequent and less reliable than swing breaks.
The "Almost Broke" Trap
You will see candles where the wick pierces a swing level but the body closes just above (or below) it. This feels like a break. It looks dramatic on the chart. But by the rules, the level held.
Do not override this rule with your feelings. "It almost broke" is not the same as "it broke." The mechanical rule exists specifically to protect you from these emotional reads. Trust the body close.
How EdgeFlo Fits Into Your Structure Mapping
EdgeFlo keeps your swing structure rules visible while you trade. Your plan sits next to your chart, so the body close rule and strong/weak criteria are always in front of you, not buried in a notebook you forgot to open.
After each session, the journal shows you where you entered relative to your mapped swing levels. Did you trade with the swing trend or against it? Did you wait for the body close confirmation or jump on a wick? That kind of specific feedback, tied to your own rules, builds real consistency over time.
The pre-trade checklist prompts you to confirm your swing structure bias before entering. It is one less thing to forget during a fast-moving session, and one more barrier between you and an impulsive trade against the trend.
The Edge Brief
Receive Insights on trading psychology, discipline, and the behavioral patterns that create consistent traders from our Founder and the EdgeFlo team, delivered to your inbox.
Think different. Trade different.
What is swing structure in trading?
How do you identify a swing high or swing low?
What is the difference between a strong high and a weak high?
When is a swing level invalidated?

Turn discipline on.
Every session.
EdgeFlo is the environment serious traders operate inside.
Start 7-Day Trial — $7
Cancel anytime.
No long-term commitment.


Think Different, Trade Different.