

Swing Range Setup: Define Your Trading Battlefield
Map your swing range from the most recent break of structure to filter noise and focus only on high-probability zones. Step-by-step 4H chart guide.

Open any chart without a plan and every single candle looks like it matters. Every wick feels like a signal. Every consolidation feels like a breakout about to happen. The problem is not the chart. The problem is that you are looking at too much of it.
The swing range solves this by drawing two lines on your 4-hour chart and declaring everything outside them irrelevant. Once you define that range, your analysis narrows to a battlefield you can actually read.
TL;DR
The swing range runs from the swing low to the swing high after the most recent break of structure.
Everything outside this range is noise from a previous move and should be ignored.
The range focuses your zone identification, bias, and entry decisions into a tight area.
Update your swing range every time a new break of structure occurs.
This single habit eliminates the paralysis of looking at too much chart history.
What a Swing Range Is and Why It Matters
A swing range is the distance between two points: the swing low that caused the most recent break of structure and the swing high where price started pulling back.
In a bullish market, the swing low is the lowest point that launched the impulsive move upward. The swing high is the peak of that move before the pullback began. The space between those two points is your current playing field.
Why does this matter? Because without boundaries, you end up drawing zones from three weeks ago that no longer influence current price action. You build biases from structure that has already been broken. You see patterns in data that has expired.
The swing range keeps you honest. It says: this is the most recent story the market is telling. Focus here. Everything else is history.
How to Map Your Swing Range on 4H
Here is the exact process, step by step.
Step 1: Find the most recent break of structure. On the 4-hour chart, look for the last time price broke a significant swing high (bullish) or swing low (bearish). This is your anchor event.
Step 2: Mark the swing low. In a bullish scenario, this is the lowest candle body or wick that initiated the impulsive move upward. It is the origin point. Without this low, the breakout never happens.
Step 3: Mark the swing high. This is the highest point price has reached since that breakout before the current pullback started. It represents the peak of buyer control.
Step 4: Connect them. Draw a horizontal line at the swing low and another at the swing high. The area between them is your swing range.
For the bearish version, flip everything. The swing high is the origin of the impulsive move down, and the swing low is the deepest point reached before the pullback.
Walkthrough: Mapping the Range on GBP/USD 4H
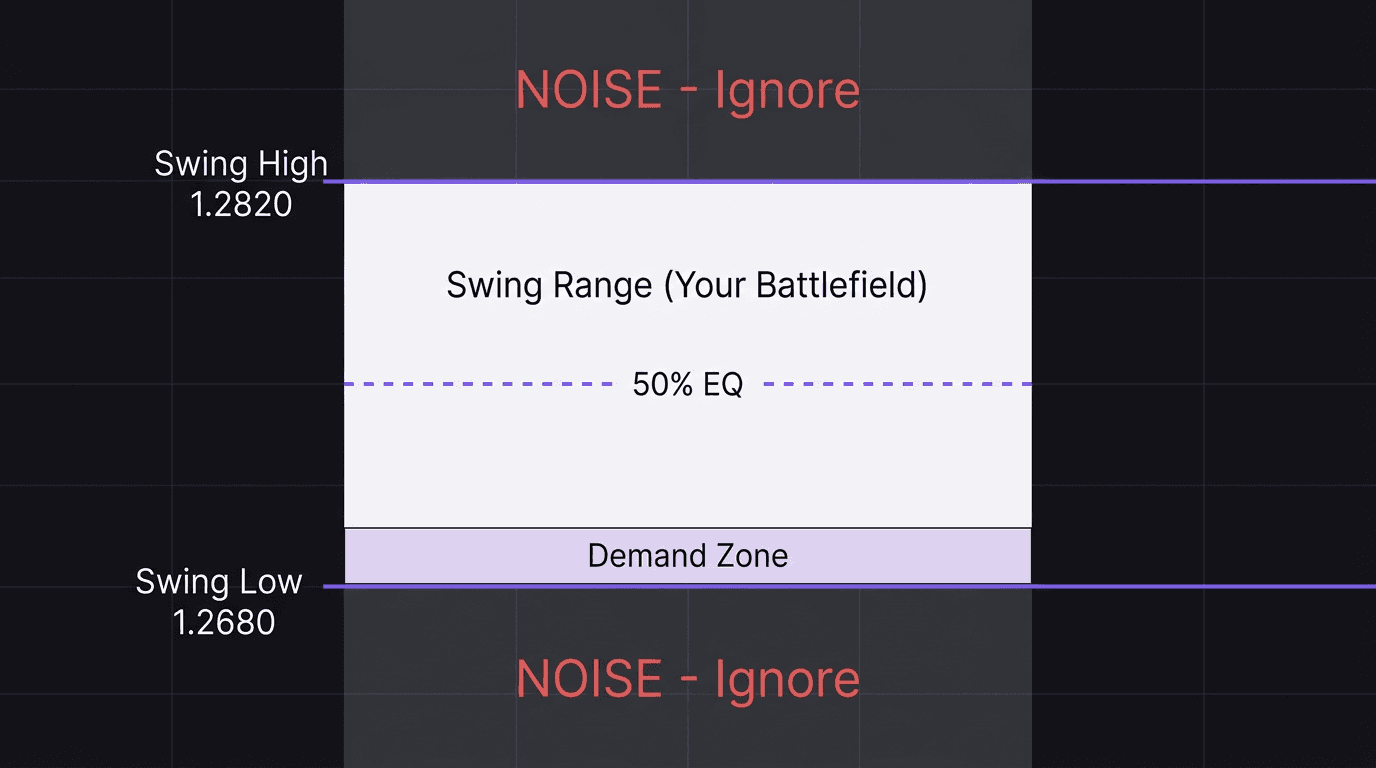
GBP/USD has been trending up on the 4H. Price made a series of higher highs and higher lows. The most recent breakout occurred when price pushed above 1.2750, a previous swing high that had held for five days.
The candle that launched this breakout started its impulsive move from 1.2680. That is the swing low. Price ran up to 1.2820 before sellers started pulling it back. That is the swing high.
Your swing range: 1.2680 to 1.2820. That is 140 pips of focused battlefield.
Now when you look at price action around 1.2600 (below the range) and wonder, "Should I draw a demand zone here?", the answer is no. That level is outside your range. It belongs to a previous move.
Everything Outside the Range Is Noise
This is the part traders resist. You spent 30 minutes marking up zones from two weeks ago, and now someone is telling you to ignore them. But those old zones exist in a different structural context.
Think about it this way. Every break of structure resets the board. The swing low that mattered three breakouts ago has been swept, tested, and left behind. The buyers or sellers who placed orders there have already been filled or stopped out. The zone is dead.
Your supply and demand zones should be identified within the current swing range. In a bullish range, you care about demand zones between the swing low and equilibrium. In a bearish range, you care about supply zones between the swing high and equilibrium.
This filter alone eliminates 70% of the confusion on a chart. You go from eight potential zones to two or three. Decisions become obvious instead of agonizing.
Walkthrough: Defining the Range on a Live Chart
Here is a common mistake to watch for. EUR/JPY on the 4H shows a bearish break of structure. Price broke below 162.50, a swing low that held for a week. The swing high that launched this move sits at 163.80. The current pullback has price climbing back toward 163.20.
The correct swing range: 163.80 (swing high) down to 162.50 (swing low). You are bearish, so you want to sell in premium, meaning supply zones between the equilibrium (163.15) and the swing high (163.80).
The common mistake: A trader maps a supply zone at 164.50, which formed before the break of structure. That zone is outside the swing range. It belongs to the old structure. Price may never reach it in the current pullback, and even if it does, the context has changed.
Another mistake is mapping the swing range too wide by going back to a break of structure from two weeks ago instead of the most recent one. The rule is simple: always use the last break. The most recent one. Not the biggest one. Not the cleanest one. The last one.
Your stop loss placement should also respect the swing range. In a bullish setup, your stop goes below the swing low because that is the price point where your entire bullish thesis dies. If price breaks the swing low, you are not in a pullback anymore. You are in a trend reversal.
How EdgeFlo Tracks Your Range Discipline
Knowing the swing range concept is one thing. Actually restricting your analysis to it, day after day, is another. The pull of old zones and wide chart views is strong, especially after a losing streak when you start questioning your current range.
EdgeFlo's journal auto-imports your trades and lets you tag whether you entered within your defined swing range or outside it. Over 20 or 30 trades, the data tells a clear story. Trades inside the range cluster around better R multiples. Trades outside it scatter randomly.
That kind of evidence is hard to argue with. When your own journal shows that range discipline correlates with better outcomes, the temptation to chase zones from last week fades. The process reinforces itself.
What is a swing range in trading?
How do you find the swing range on a 4H chart?
Why should I ignore price action outside the swing range?
Does the swing range change as new structure forms?

Turn discipline on.
Every session.
EdgeFlo is the environment serious traders operate inside.
Start 7-Day Trial — $7
Cancel anytime.
No long-term commitment.


Think Different, Trade Different.