

Swing Range Mapping: Track the Boundaries That Matter
Swing range mapping defines the high and low that contain current price action. Track these boundaries to know when price is trending, pulling back, or reversing.

Every trade happens inside a range. The swing high above. The swing low below. Those two levels define the playing field for current price action, and most of what happens between them is either a continuation toward the weak boundary or a pullback toward the strong one.
Swing range mapping means identifying those two levels, understanding which one is strong (protected) and which one is weak (expected to break), and then using that information to frame every internal move. When you know the range, you know whether price is trending, pulling back, or stalling. Without it, you are reacting to individual candles with no structural context.
TL;DR
The swing range is defined by the current swing high and swing low.
One boundary is "strong" (protected by the trend) and the other is "weak" (expected to break).
All internal order flow happens inside this range: pullbacks, consolidation, and continuation moves.
Mapping the swing range first prevents you from trading against the dominant structure.
Update the range whenever a new break of structure redefines the swing points.
What the Swing Range Actually Is
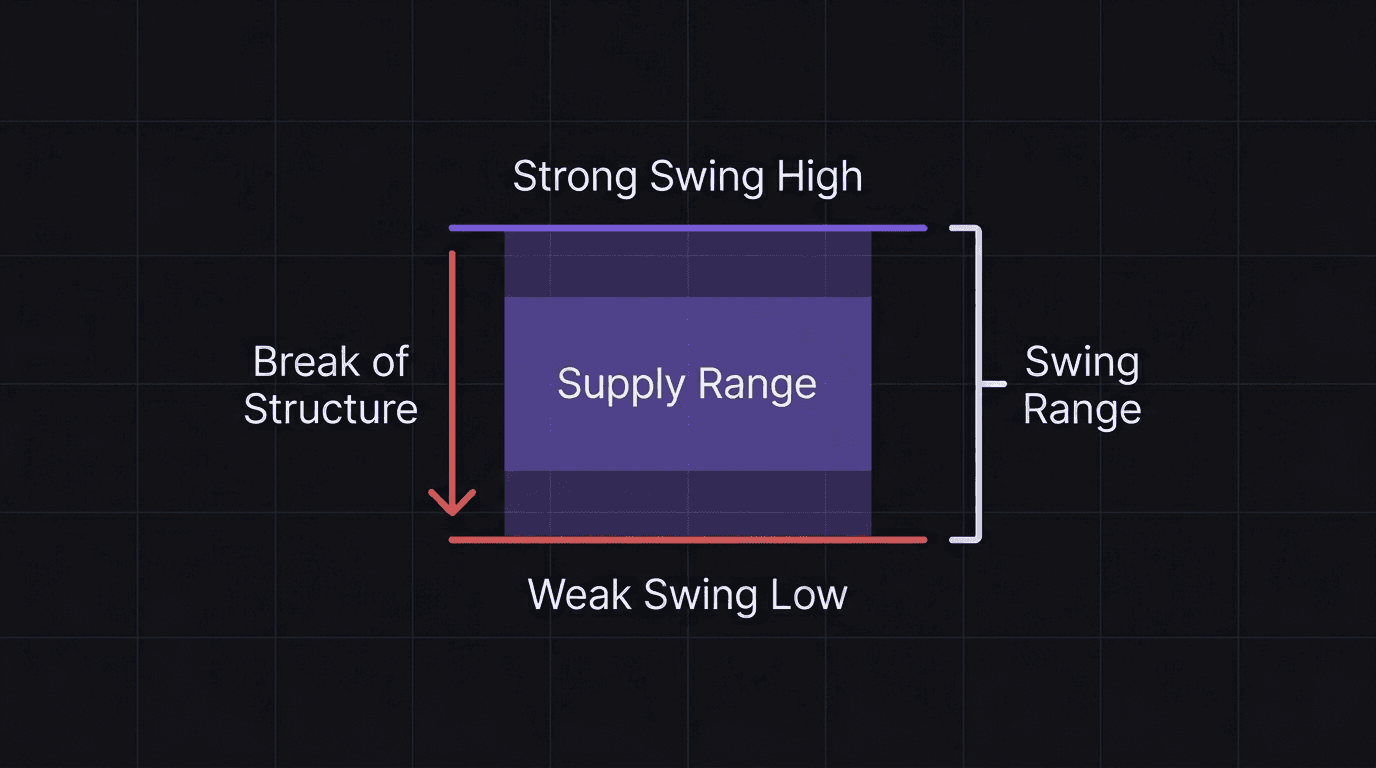
The swing range is the space between two anchor points: the swing high and the swing low. In a bearish trend, the swing high is the strong point (price has not taken it out) and the swing low is the weak point (the most recent low that was broken or is expected to break).
In a bullish trend, flip it. The swing low is strong, the swing high is weak.
This is not arbitrary. The strong point represents the level that, if broken, would shift the entire market structure. The weak point represents the level that the current trend is expected to take out to create a new leg.
Think of it like a playing field with a finish line and a boundary. The finish line (weak side) is where the trend wants to go. The boundary (strong side) is the line that tells you the game has changed if it breaks.
Why Mapping the Range Comes First
Before you do anything else on a chart, you need the swing range. Before you draw zones. Before you look at internal structure. Before you think about entries.
Here is why: the swing range tells you the direction of the dominant order flow. If the range has a strong high and a weak low, the swing order flow is bearish. Your bias is short. Every internal move you map exists inside that context.
Without the range, you might see an internal bullish move (price making higher highs and higher lows on the internal structure) and think the trend is bullish. But zoom out and that bullish internal move is just a pullback inside a bearish swing range. It is temporary. It is counter-trend. And it will likely resolve with a shift back to bearish once price reaches the supply range near the strong high.
The range protects you from confusing a pullback with a reversal. That confusion is one of the most expensive mistakes in trading.
How to Draw the Swing Range Step by Step
Step 1: Find the Last Break of Structure
Look for the most recent swing-level break of structure on your chart. In a bearish scenario, that is where price broke below the previous swing low with a body close.
Step 2: Mark the Swing High
The swing high is the high that led to the break. In a bearish BOS, this is the high that formed before price pushed down and broke the low. Mark it with a horizontal line or highlight.
This is your strong swing high. As long as this level holds, the bearish structure is intact.
Step 3: Mark the Swing Low
The swing low is the most recent low that has been broken (confirming the BOS), or the new low that price is currently targeting.
This is your weak swing low. The bearish trend expects price to take out this level and create a new lower low.
Step 4: Label Strong and Weak
Write it on your chart or in your notes. "Strong SH" at the top, "Weak SL" at the bottom. This sounds basic, but labeling the boundaries forces you to think about which direction the trend favors.
Step 5: Draw the Supply Range
In a bearish swing range, the supply range runs from the swing high down to the swing low. This is the zone price is expected to pull back into before continuing down. The supply range is where you will look for selling opportunities once the internal order flow confirms a shift back to bearish.
Walkthrough: Mapping a Live Bearish Swing Range
You open USD/JPY on the 4-hour chart. Price has been making lower highs and lower lows. The most recent move: price pushed down from a high around 151.80, broke below the previous swing low at 150.40, and is now trading around 150.10.
Step 1: The last BOS is the break below 150.40.
Step 2: The swing high that led to this break is 151.80. Mark it: "Strong SH at 151.80."
Step 3: The swing low is the new low, currently at 149.90 (the lowest point since the break). Mark it: "Weak SL at 149.90."
Step 4: The swing range is 151.80 to 149.90. That is 190 pips of range.
Step 5: The supply range runs from 151.80 down toward 150.40 (the area from the strong high to the BOS level). This is where you expect the pullback to reach before selling pressure returns.
Now you track the internal order flow inside this range. Price is currently making higher highs and higher lows on the internal structure, pulling back toward the supply range. That internal bullish flow is temporary. Your trading plan is to wait for the internal order flow to shift bearish near the supply range, then look for short entries targeting a new low below 149.90.
If price breaks above 151.80 instead, the entire swing range resets. That strong high break would signal that the bearish swing order flow is over and a potential bullish reversal is forming.
What Not to Do: Selling Before the Pullback Completes
A common mistake is seeing price enter the supply range and immediately entering short. The swing range is bearish, the supply zone is right there, so it feels like a valid trade.
But the internal order flow is still bullish. Price is still making higher highs and higher lows on the internal structure. Entering short here means fighting the current internal flow, even though the swing direction favors shorts.
The higher probability play: wait for the internal structure to shift bearish (a market shift where price breaks the last internal higher low). Then enter from the new supply zone that forms after the shift. Both the swing and internal order flow are now aligned, and your entry has structural confirmation rather than just zone proximity.
Using the Swing Range as a Dashboard Metric
Your swing range is not just a chart drawing. It is a framing tool for your entire session.
Before every trade, ask: "Where is the price inside the swing range?" If it is near the strong boundary, expect increased probability of reversal or strong pullback reactions. If it is near the weak boundary, expect continuation or a potential break.
This framing changes how you evaluate setups. A long entry near the strong swing high of a bearish range is extremely risky. A short entry near the same level, after internal confirmation, is the highest probability setup available.
Track this in your trading dashboard. Note the swing range boundaries at the start of each session. At the end of the session, check: did price stay inside the range? Did it break a boundary? Did you trade with the range direction?
Over time, this data shows you how well you read swing structure. Your performance review can include a swing range accuracy metric: "How often did I correctly identify the strong and weak boundaries before the session started?"
If your equity curve shows a dip, check whether you were trading against the swing range during that period. Counter-range trades are the silent account drainer that most traders never track.
When the Swing Range Resets
The swing range is not permanent. It updates whenever a new break of structure occurs.
In a bearish trend: if price breaks below the current weak swing low, the range resets. The old swing low becomes irrelevant. The new weak low is wherever price reaches, and the new strong high is the high that led to this latest break.
In a bullish trend: if price breaks above the current weak swing high, same reset logic. New strong low, new weak high, new range.
The critical scenario is when price breaks the strong boundary. If the bearish swing range has a strong high at 151.80 and price breaks above it with a body close, the bearish structure is broken. The swing order flow has shifted. You need to re-map everything.
This is why the strong boundary label matters. It is your invalidation level for the entire swing thesis.
How EdgeFlo Helps You Track Swing Ranges
EdgeFlo's dashboard gives you a centralized view of your trading metrics, including win rate, average R, profit factor, and EdgeScore. When you combine these metrics with swing range awareness, you get a clearer picture of where your edge lives.
If you track which trades were taken inside the swing range versus against it, your dashboard metrics split into two buckets: "with-range trades" and "counter-range trades." Most traders find their edge exists almost entirely in the first bucket. That insight alone can reshape how you select trades each session.
The Edge Brief
Receive Insights on trading psychology, discipline, and the behavioral patterns that create consistent traders from our Founder and the EdgeFlo team, delivered to your inbox.
Think different. Trade different.
What is a swing range in trading?
How do I identify a strong swing high versus a weak swing low?
Should I trade inside the swing range or wait for a breakout?
How often should swing range levels be updated?

Turn discipline on.
Every session.
EdgeFlo is the environment serious traders operate inside.
Start 7-Day Trial — $7
Cancel anytime.
No long-term commitment.


Think Different, Trade Different.