

Supply and Demand as Your Trading Foundation
Market structure and supply/demand zones are the foundation of every trading strategy. Learn why mastering them before adding liquidity concepts is critical for beginners.

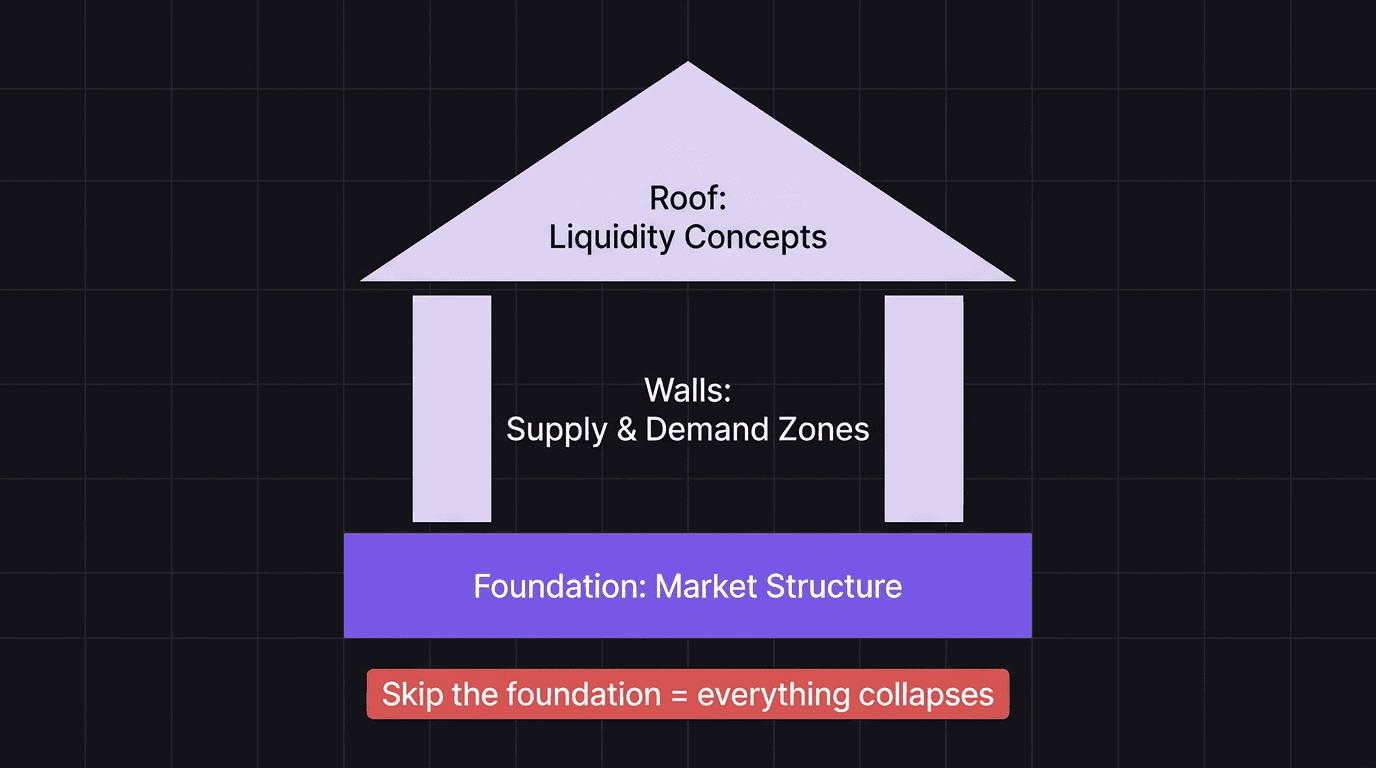
Market structure and supply and demand zones are the foundation of every profitable trading strategy. Without them, nothing else works. Not liquidity concepts. Not order flow analysis. Not fancy entry models. The traders who struggle most are the ones who skipped the foundation and went straight to advanced techniques, like building a house without pouring the concrete first.
Market structure (trend direction) and supply/demand zones (entry locations) are the trading foundation.
Every advanced concept (liquidity, inducements, order flow) is a refinement layer on top of this foundation.
A strong foundation survives any market condition. A weak one collapses under the first pullback.
Most beginner failures come from skipping the foundation, not from using the wrong indicator.
Master structure and zones first. Add complexity only after these two skills are reliable.
Why Structure Comes Before Everything
Before you can identify a good trade, you need to know which direction the market is moving. That is what market structure tells you.
Break of structure is the simplest framework: higher highs and higher lows mean bullish. Lower highs and lower lows mean bearish. A break of that pattern signals a potential shift.
This sounds too simple to matter. It is actually the filter that prevents most bad trades. When you buy during a confirmed downtrend, you are fighting the current. When you sell during a confirmed uptrend, you are swimming upstream. The setup might look perfect on the lower timeframe, but the higher timeframe structure tells you the probability is against you.
Walkthrough: Structure saves the day. AUD/USD on the 4H chart shows three consecutive lower highs: 0.6580, 0.6550, 0.6520. A beginner trader spots a "beautiful demand zone" at 0.6480 on the 1H chart and buys, expecting a bounce. Price bounces 15 pips and then drops through 0.6480 to 0.6440. The demand zone was valid on the 1H timeframe, but the 4H structure was clearly bearish. Bearish structure overrides demand zone quality. The trader who checked structure first would have skipped this trade entirely.
Structure is not complicated. It does not require special indicators. You look at swing highs and swing lows and determine which direction they are moving. If you cannot do this reliably on a clean chart, adding more concepts will only create confusion, not clarity.
Points of Interest Are Your Entry Zones
Once you know the direction, you need to know where to enter. That is what points of interest provide: specific price zones where institutional orders previously entered the market.
The most common points of interest are supply zones (where sellers overwhelmed buyers and price dropped sharply) and demand zones (where buyers overwhelmed sellers and price rose sharply). When price returns to these zones, the same institutional interest may still be there.
A supply zone in a bearish structure is a high-probability sell location. A demand zone in a bullish structure is a high-probability buy location. The structure tells you the direction. The zone tells you the address.
The difference between a vague "support level" and a specific point of interest is precision. You are not drawing a horizontal line across the chart and hoping price bounces. You are identifying the exact candle (or candle range) that caused the move and marking that as your zone. This precision narrows your risk and improves your entry price.
Walkthrough: Zone precision matters. GBP/USD is in a bullish structure. A "support level" is drawn at 1.2650 based on a few previous bounces. A demand zone is identified at 1.2635 to 1.2645, the specific candle range that launched the last bullish impulse. Price drops to 1.2640 and reverses. The "support" trader entered at 1.2650 with a stop at 1.2620 (30-pip risk). The zone trader entered at 1.2640 with a stop at 1.2620 (20-pip risk). Both hit the same target at 1.2710. The support trader made 60 pips with 30-pip risk (2:1 R:R). The zone trader made 70 pips with 20-pip risk (3.5:1 R:R). Same direction. Same market. Different precision.
Liquidity Is the Bonus Layer, Not the Base
Liquidity concepts are powerful. They show you where resting orders cluster, which levels are likely to get swept, and why price moves to certain areas before reversing. But they are a refinement tool, not a foundation.
Think of it this way: structure and zones get you 80% of the way. Liquidity and other advanced concepts add the final 20% of accuracy and timing. That extra 20% matters. But without the 80% base, the 20% has nothing to build on.
Traders who skip to liquidity concepts often face a specific problem: they can see where the liquidity pool sits, but they have no idea whether price is likely to go there in the first place. They see equal lows at 1.0800 and know there is sell-side liquidity below, but without checking structure, they do not know if the current bullish trend is strong enough to make that sweep unlikely. They end up trading every liquidity level as if it is guaranteed to get hit.
The foundation gives you the filter. Structure tells you which pools are likely to get swept (the ones in the trend direction). Zones tell you where price is likely to react after the sweep. Liquidity tells you the exact mechanism that triggers the reaction.
All three work together. None of them work alone.
The Foundation Analogy That Saves Beginners
A house without a solid foundation crumbles. It does not matter how nice the walls are, how expensive the finishes, or how modern the design. If the foundation cracks, everything above it fails.
Trading is the same. You can learn every advanced concept in the book (liquidity sweeps, inducements, breaker blocks, mitigation). But if you cannot identify a clear bullish or bearish structure, and if you cannot mark a valid supply or demand zone, those advanced concepts become noise that clouds your decision-making.
The traders who succeed fastest are the ones who spend extra time on the boring stuff. They practice identifying structure on 50 charts before adding zones. They practice marking zones on 50 more charts before adding liquidity. Each layer gets its own focused practice time.
Here is the simple test: open a chart you have never seen before. Within 30 seconds, can you identify the current structure (bullish, bearish, or consolidating) and mark at least one valid zone? If yes, you are ready for the next layer. If no, stay here. The foundation is not finished yet.
How EdgeFlo Documents Your Trading Foundations
The gap between understanding the foundation and consistently applying it is discipline. Under live-market pressure, traders skip structure checks, enter at vague zones, and forget the process that works in practice sessions.
EdgeFlo's Edge plan builder lets you write out your foundation process as your active trading playbook. Document the exact steps: "Check 4H structure first. Mark valid demand zone. Confirm zone is in discount. Set alert. Wait." That plan sits visible on screen during every trading session.
After each trade, the post-trade self-report in Edge asks whether you followed the steps. Did you check structure? Did you identify a valid zone? Did you wait for confirmation? Over weeks, you build a clear record of when you follow the foundation and when you skip it. The correlation between following the process and profitable outcomes becomes visible in your own data, which is more convincing than any article.
Is supply and demand enough to trade profitably?
Should I learn order blocks before supply and demand?
When should I add liquidity concepts to my trading?
Why do beginners fail when they skip to advanced concepts?

Turn discipline on.
Every session.
EdgeFlo is the environment serious traders operate inside.
Start 7-Day Trial — $7
Cancel anytime.
No long-term commitment.


Think Different, Trade Different.