

Risk Reward Ratio Explained: Why 5R Beats 2R
Risk reward ratio explained with simulation data. See why a 1:5 RR at 30% win rate is profitable while 1:2 loses money, and how to measure it correctly.

Your risk-to-reward ratio is the single number that determines whether your trading account grows or bleeds. It measures how much you stand to gain on a winning trade relative to how much you lose on a loser. A 1:2 ratio means you risk $1 to make $2. A 1:5 ratio means you risk $1 to make $5. The difference between those two numbers is not a minor tweak. At a 30% win rate, the 1:2 trader loses money over time while the 1:5 trader walks away profitable. That is not theory. Simulation data across 100 different scenarios proves it.
TL;DR
Risk-to-reward ratio compares the size of your average loss to the size of your average win, expressed as R-multiples.
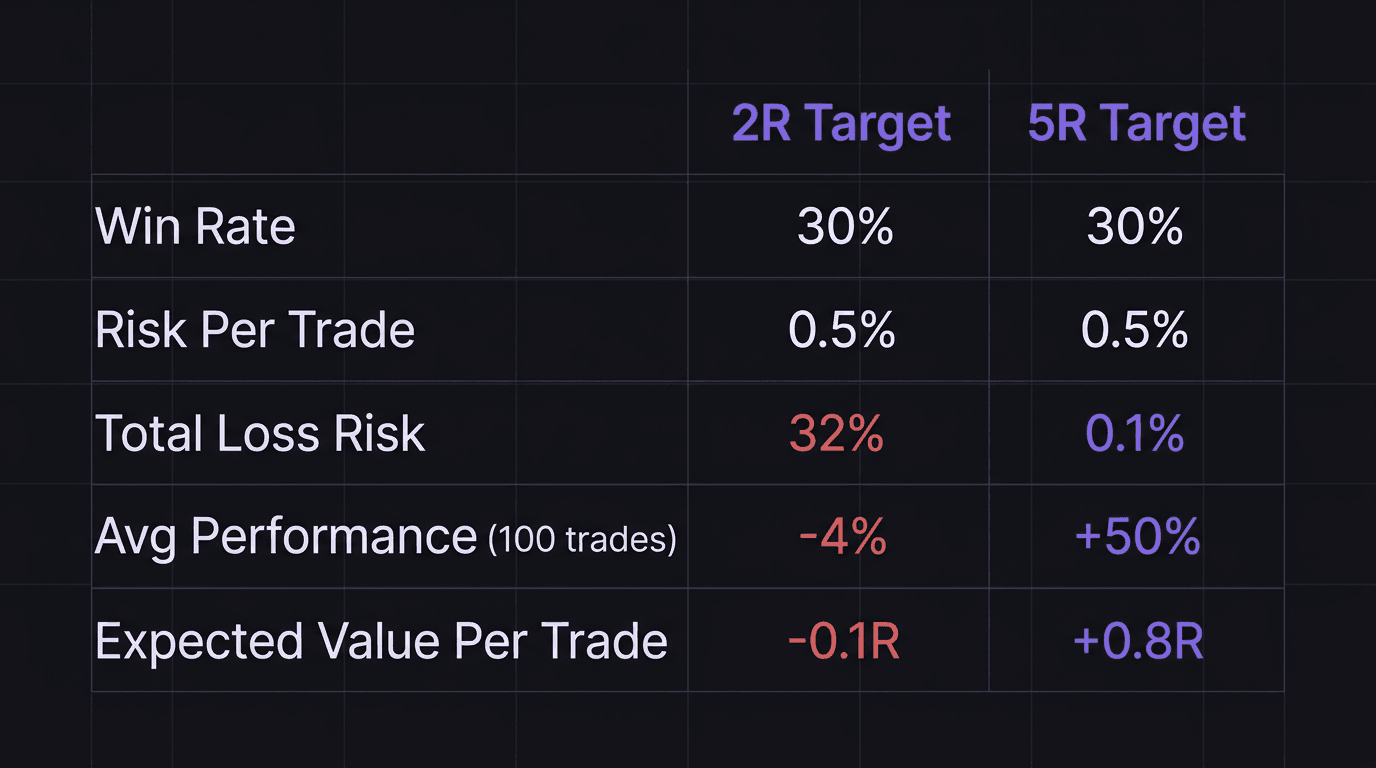
At a 30% win rate, a 2R target produces a negative expected value of -0.1R per trade and an average loss of -4% over 100 trades.
The same 30% win rate with a 5R target flips to +0.8R expected value per trade and an average gain of +50% over 100 trades.
Always place your stop loss at the technical invalidation point first, then check the resulting ratio. Never squeeze a stop to fake a higher R.
Minimum acceptable ratio is 1:2. Target is 1:5.
What Risk Reward Ratio Means
Think of R as a scoring unit. Every trade you take either gains R or costs R. If you risk 0.5% of your account on a trade, that 0.5% is 1R. A 5R winner means you made five times what you risked, so 2.5%. A 1R loser means you lost exactly what you risked, so 0.5%.
The ratio itself is simple division. Measure the distance from your entry price to your stop loss. That is your risk. Measure the distance from your entry to your take profit. That is your reward. Divide reward by risk.
Example: You buy EUR/USD at 1.0850. Your stop loss goes at 1.0830, which is 20 pips of risk. Your take profit goes at 1.0950, which is 100 pips of potential reward. 100 divided by 20 equals 5. Your risk-to-reward ratio is 1:5, or 5R.
Here is why this matters more than win rate. A trader who wins 70% of the time with a 1:1 ratio earns less than a trader who wins 30% of the time with a 1:5 ratio. The math is not intuitive, which is exactly why most beginners chase win rate instead of R. They want to feel right. Professionals want to be paid.
R-multiples let you stop thinking in dollars and start thinking in units of risk. Every closed trade is either +5R, +3R, -1R, whatever the result. This is how you measure whether your system actually has an edge over hundreds of trades. A string of losses does not mean your system is broken. It means you need to check whether the winners more than compensate.
The Simulation: 2R vs 5R at 30% Win Rate
Numbers on a page feel abstract. Simulation data does not. Here is what happens when you run 100 different scenarios of a trading strategy with a 30% win rate and 0.5% risk per trade over 100 trades.
The 2R Results
With a 2R target, the simulation data is brutal:
Total loss risk (account blow-up chance): 32%
Average performance: -4%
Maximum performance: +10%
Minimum performance: -10%
Read that again. The average outcome over 100 trades is that you lose money. Not break even. Lose. The best-case scenario across all simulations is a 10% gain, and the worst case is a 10% loss. Your expected value per trade is negative: (0.30 x 2R) - (0.70 x 1R) = -0.1R. Every trade you take at 2R with a 30% win rate costs you 0.1R on average.
And the blow-up probability is 32%. One in three chance of losing everything. Would you board a plane with a 32% crash rate?
The 5R Results
Same strategy. Same 30% win rate. Same 0.5% risk per trade. Same 100 trades. Only the R-multiple changes.
Total loss risk: 0.1%
Average performance: +50%
Maximum performance: +100%
Minimum performance: +5%
The worst-case scenario is that you still make money. The expected value per trade flips to positive: (0.30 x 5R) - (0.70 x 1R) = +0.8R. Every trade adds 0.8R to your account on average.
Running the Dollar Math
Put it in concrete terms. You have a $10,000 account. You risk 0.5% per trade, which is $50.
At 2R: Each winner pays $100. Over 100 trades, you win 30 and lose 70. That is 30 x $100 = $3,000 in wins and 70 x $50 = $3,500 in losses. Net result: -$500. You traded for months and paid the market for the privilege.
At 5R: Each winner pays $250. Same 30 wins and 70 losses. That is 30 x $250 = $7,500 in wins and 70 x $50 = $3,500 in losses. Net result: +$4,000. Same win rate. Same risk. Completely different outcome.
The only variable that changed was how far you let your winners run. That is what asymmetric risk means. You accept small, controlled losses and hold for outsized gains. It feels wrong in real time because you lose more often than you win. But the math does not care about your feelings.
Place the Stop Loss First, Then Check the Ratio
Here is where most traders get the process backwards. They decide they want a 5R trade, then they reverse-engineer the stop loss and take profit to hit that number.
That is a recipe for getting stopped out on every trade.
The correct sequence is mechanical, and it should be part of your pre-trade checklist:
Identify the setup from your trading plan.
Place the stop loss at the invalidation point. This is the price level where your trade idea is objectively wrong. If you are buying a pullback to support, the stop goes below that support level. Not tighter. Not where you would "like" it to be. Where the trade is invalid.
Place the take profit at the logical target. Next resistance level, previous swing high, measured move, whatever your system targets.
Now calculate the ratio. If the result is below 1:2, skip the trade. If it is 1:3 or better, take it. If it is 1:5 or higher, that is your ideal setup.
Walkthrough (What Not to Do): You spot a short setup on GBP/USD at 1.2700. The logical invalidation is above 1.2740, which is 40 pips of risk. Your target is 1.2600, which is 100 pips away. That gives you a 1:2.5 ratio. Decent, but you want 5R. So you squeeze the stop to 1.2720, just 20 pips above entry. Now the math says 1:5. Beautiful on paper. But price wicks up to 1.2725 before dropping to 1.2590. You got stopped out for -1R, then watched the trade hit your original target without you. The fake ratio stole a real winner.
The ratio is an output of good placement. It is not an input you force.
When Tight Stop-Losses Fake a High Ratio
This deserves its own section because it is the most common mistake traders make with risk-to-reward. And it is sneaky because the chart looks great on the risk-reward tool.
You pull up a trade on your chart platform. You drag the stop-loss line close to entry. You drag the take-profit line far from entry. The ratio display shows 1:8. Incredible. You screenshot it. Maybe post it somewhere.
Then price moves 15 pips against you and stops you out. Sound familiar?
The problem is that a tight stop does not reflect where your trade idea is wrong. It reflects where you want to limit your loss. Those are two completely different things. Your stop loss has one job: mark the price where your analysis is invalidated. If you are trading a bounce off a demand zone, the stop goes below the zone. Not inside the zone. Not at the edge of the zone. Below it.
When you place a stop based on how much you want to lose instead of where the trade breaks, you create a setup that looks amazing on the risk-reward calculator but gets stopped out 80% of the time. And even though your ratio says 1:8, your actual expected value is deep negative because you almost never reach the target.
A proper risk per trade setup pairs the right stop placement with correct position sizing. If your stop needs to be 40 pips away to be valid but that feels like too much risk, you do not move the stop. You reduce the position size. That is how professionals handle it.
Walkthrough (Correct Approach): You see a buy setup on AUD/USD at 0.6550. The demand zone sits between 0.6520 and 0.6530. You place your stop at 0.6515, which is 35 pips below entry and safely below the zone. Your target is the previous swing high at 0.6725, which is 175 pips away. The ratio is 1:5 naturally. You risk 0.5% of your $10,000 account, which is $50. With a 35-pip stop, your position size is roughly 0.14 lots. Price dips to 0.6528, holds the zone, and runs to target. You collect +5R, or $250. The stop was placed correctly, so the zone had room to breathe. The ratio was real, not manufactured.
Math check: 0.14 lots x $10/pip (AUD/USD standard lot) = $1.40/pip. $1.40 x 35 pips = $49, which rounds to the $50 risk target. Win: $1.40 x 175 pips = $245, approximately $250. Checks out.
How EdgeFlo Shows Your R on Every Trade
After you close a trade, the real question is not "did I make money?" It is "what was my R-multiple?" That is the number that tells you whether your system is working across dozens or hundreds of trades.
EdgeFlo's Trading Dashboard displays the R-multiple on every closed trade automatically. You do not need to pull out a calculator or build a spreadsheet. Enter a trade with a defined stop and target, close it, and the journal shows you exactly how many R you captured or lost. Over time, you build a dataset of R-multiples that tells you your actual expected value per trade.
That feedback loop is what separates guessing from knowing. You can backtest your strategy and see whether your average R is closer to 2 or 5. If it is stuck at 2R, you know the problem is not your win rate. It is your exit strategy. And you can fix it with data instead of feelings.
The Edge Brief
Receive Insights on trading psychology, discipline, and the behavioral patterns that create consistent traders from our Founder and the EdgeFlo team, delivered to your inbox.
Think different. Trade different.
What is a good risk reward ratio for beginners?
Can you be profitable with a low win rate?
How do you calculate risk reward ratio?
Should I move my stop loss to improve my risk reward ratio?

Turn discipline on.
Every session.
EdgeFlo is the environment serious traders operate inside.
Start 7-Day Trial — $7
Cancel anytime.
No long-term commitment.


Think Different, Trade Different.