

Risk Reward Ratio: Why 1:5 Beats 1:2 Every Time
See the simulation data that proves a 1:5 risk reward ratio outperforms 1:2 even with a 30 percent win rate. Numbers, not opinions.

A 1:5 risk reward ratio means you aim to make five times what you risk on every trade. With a 30% win rate and 0.5% risk per trade, a 1:5 ratio produces an average 50% return over 100 trades with a 0.1% chance of blowing your account. The same win rate at 1:2 loses money on average and carries a 32% wipeout probability. The numbers are not close.
Most risk reward discussions online cover the definition and stop there. Here is what they skip: the interaction between R multiple, win rate, and total loss risk across hundreds of trades. That interaction determines whether your system makes money or bleeds you dry over months.
TL;DR
Risk reward ratio (R:R) is the distance to your target divided by the distance to your stop loss.
At 1:2 R:R with a 30% win rate, simulations show you lose money on average (negative 4%) with a 32% chance of total account loss over 100 trades.
At 1:5 R:R with the same 30% win rate, average return jumps to 50% and total loss risk drops to 0.1%.
The biggest mistake is tightening your stop loss to force a higher R:R instead of placing stops correctly first.
Think in R multiples, not dollar amounts, because R scales with your position size regardless of account balance.
What R:R Actually Measures
Your risk reward ratio is a simple division: target distance divided by stop distance.
If your stop loss is 20 pips and your take profit is 100 pips, your R:R is 100 / 20 = 5. That is a 1:5 trade. You risk 1 unit to gain 5.
The "R" in R multiple stands for your risk. One R equals whatever dollar amount you risked on the trade. If you risked $50 (0.5% of a $10,000 account), then 1R = $50, and a 5R win = $250.
This framing matters because it separates the quality of the trade from the size. A 5R win on a $500 account and a 5R win on a $50,000 account are the same quality of execution. The only difference is the dollar amount, which is determined by your risk per trade setting.
The Simulation Data: 1:2 vs 1:5
This is where opinions end and math begins. Take the same strategy parameters and change only the R:R target. Everything else stays identical: 30% win rate, 0.5% risk per trade, $100,000 account, 100 simulations.
1:2 R:R (100 trades, 0.5% risk)
Total loss risk: 32%
Average performance: negative 4%
Maximum performance: +10%
Minimum performance: negative 10%
You read that correctly. At 1:2 with a 30% win rate, you lose money on average. The best-case scenario is a 10% gain. The worst case is a 10% loss. And roughly one in three simulations ends with a blown account.
1:5 R:R (100 trades, 0.5% risk)
Total loss risk: 0.1%
Average performance: +50%
Maximum performance: +100%
Minimum performance: +5%
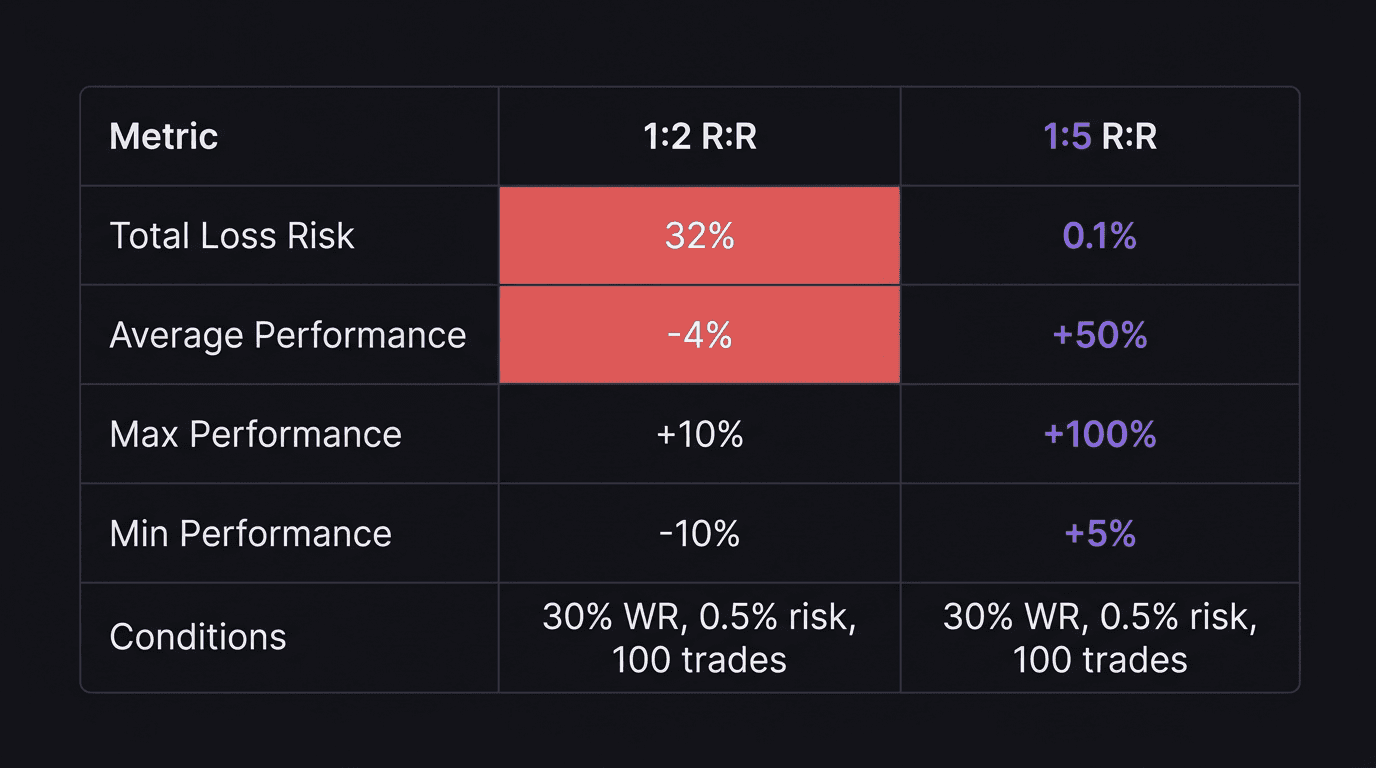
The worst-case scenario at 1:5 is a 5% gain. Even if you hit the unluckiest sequence of trades possible, you still make money. That is the power of asymmetric returns.
Why the Math Works This Way
With a 30% win rate at 1:2, you win 30 trades and lose 70 out of 100.
30 wins at 2R each = 60R gained
70 losses at 1R each = 70R lost
Net: negative 10R
You are underwater. Every 100 trades costs you 10R. If your R is $500 (0.5% of $100,000), that is a $5,000 loss over 100 trades.
Now the same 30% win rate at 1:5:
30 wins at 5R each = 150R gained
70 losses at 1R each = 70R lost
Net: positive 80R
Positive 80R. At $500 per R, that is $40,000 profit over 100 trades, even while losing 70% of them. Your trading expectancy is +0.8R per trade.
That is the core insight: a high R:R ratio compensates for a low win rate. You do not need to win most of your trades. You need to win big when you do win and lose small when you lose.
The Stop Loss Trap
Here is the mistake that destroys more accounts than bad R:R targeting: tightening the stop loss to inflate the ratio.
Say you find a trade setup on GBP/USD where the logical stop loss (below the demand zone) is 40 pips and the target (next supply zone) is 120 pips. That is a clean 1:3 trade.
But you want 1:5. So instead of placing the stop at 40 pips where structure demands it, you squeeze it to 24 pips.
Walkthrough: Forcing 1:5 by Tightening the Stop
GBP/USD, 1H chart. Demand zone at 1.2600. You enter long at 1.2640.
Correct stop placement: Below the demand zone at 1.2600. Stop distance: 40 pips. Target at the next supply zone, 1.2760. Target distance: 120 pips. R:R = 1:3.
Forced stop placement: You move the stop to 1.2616 (24 pips) to get 120 / 24 = 1:5. The stop now sits inside the demand zone.
What happens: price dips to 1.2610 as it sweeps the zone (normal liquidity behavior), hits your stop, and then rallies to 1.2780. You were right about the direction. You were right about the zone. But you got stopped out because your stop loss was placed for ratio optimization, not for structural validity.
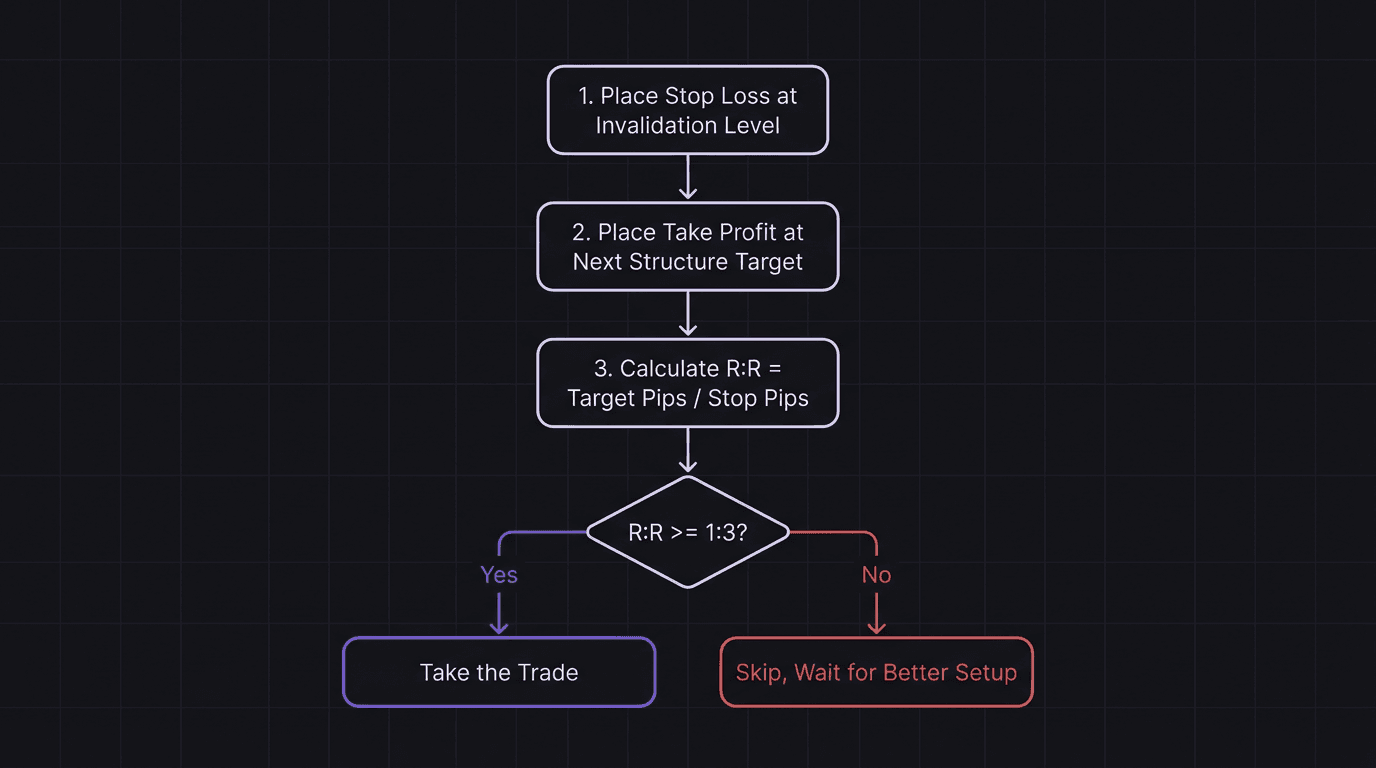
The correct approach: place your stop loss where the trade idea is invalidated (below the zone). Place your target where structure says price is likely to react (the next zone). Then calculate the R:R. If it is 1:3, that is fine. If it is below 1:2, skip the trade.
Do not force the ratio. Let the chart give you the numbers. If you backtest your strategy properly, you will find that honest 1:3 trades taken at the right locations outperform forced 1:5 trades that get stopped out constantly.
Why 30% Win Rate Is Not a Problem
A 30% win rate sounds terrible until you pair it with asymmetric returns. Think of it this way: you lose 7 trades in a row, each costing 0.5% of your account. That is 3.5% total drawdown. Then you win 3 trades, each returning 2.5% (5R at 0.5% risk).
7 losses: 7 times 0.5% = 3.5% drawdown
3 wins: 3 times 2.5% = 7.5% gain
Net after 10 trades: +4.0%
You lost 70% of those trades and still came out ahead by 4%. Over 100 trades, that compounds into the 50% average return shown in the simulations.
The psychological challenge is real, though. Seven losses in a row will test you. That is where position sizing at 0.5% saves you: the dollar losses stay manageable, so you do not panic-quit the system before the winning trades arrive.
How to Apply 1:5 Targeting Without Forcing
The practical approach is a two-step filter:
Identify structure first. Mark your invalidation level (where the trade idea is wrong) and your target level (where price is likely to react). Use swing highs, demand/supply zones, or liquidity levels.
Calculate the R:R after placement. If the ratio is 1:5 or better, you found a high-quality entry. If it is between 1:3 and 1:5, it is still worth considering. Below 1:2, walk away.
The best 1:5 trades happen naturally when you catch a move early in a fresh trend, near a deep discount zone, with a clean invalidation point close by. You are not forcing the ratio. The market structure creates it.
Some trading sessions produce multiple 1:5 setups. Other weeks produce zero. That is normal. The mistake is lowering your standards because you have not traded in three days. Patience is the price of asymmetric returns.
How EdgeFlo Helps You Track R Multiples
EdgeFlo logs every trade in R multiples, not just dollar amounts. Your trading dashboard shows average R per winning trade, average R per losing trade, and your overall expectancy. You can see at a glance whether your system is producing asymmetric returns or if your average win and average loss are converging.
The weekly AI report flags when your R multiples drop. If you were averaging 4R winners last month and this month you are averaging 2.5R, the report surfaces that change before it erodes your edge. You can then review your journal to identify whether you are cutting winners early, taking subpar setups, or tightening stops without justification.
R-based tracking removes the distortion of variable position sizes. Two traders can have the same R performance with completely different dollar P&L because one trades a $5,000 account and the other trades $50,000. The R tells you the skill; the dollars just reflect the account size.
What is a good risk reward ratio for trading?
Can you be profitable with a 1:2 risk reward ratio?
How do you calculate risk reward ratio?
Is a higher risk reward ratio always better?

Turn discipline on.
Every session.
EdgeFlo is the environment serious traders operate inside.
Start 7-Day Trial — $7
Cancel anytime.
No long-term commitment.


Think Different, Trade Different.